 뒤로
뒤로Kinematics Exam Review – Step-by-Step Study Guidance
스터디 가이드 - 스마트 노트
 자료에 맞춘 맞춤형 노트, 핵심 정의, 예시, 맥락을 확장해 제공합니다.
Q6a. What is the uncertainty of the trials for the model train's acceleration?
Background
Topic: Experimental Uncertainty in Kinematics
This question is about determining the uncertainty (or error) in a set of experimental measurements, specifically the acceleration values measured for a model train.
Key Terms and Formulas
Uncertainty: A quantitative measure of how much measured values deviate from each other.
Mean (Average):
Uncertainty (Range or Standard Deviation): For a small data set, uncertainty can be estimated as the range (max - min) or the standard deviation:
Step-by-Step Guidance
Look at the table of acceleration values from the trials (see image below for reference).

Identify all the acceleration values recorded in the trials.
Calculate the mean (average) acceleration using the formula above.
To estimate uncertainty, you can either:
Find the range (maximum value minus minimum value), or
Calculate the standard deviation using the formula provided.
Express the uncertainty as either the range or the standard deviation, depending on what your instructor prefers.
Try solving on your own before revealing the answer!
Final Answer:
The uncertainty of the trials is best represented by the standard deviation of the acceleration values. Using the data from the table, calculate the mean, then use the standard deviation formula:
For example, if the acceleration values are 0.12, 0.15, 0.13, 0.14, and 0.16 m/s2, the mean is 0.14 m/s2 and the standard deviation is approximately 0.015 m/s2. So, the uncertainty is about ±0.015 m/s2.
This value tells you how much the acceleration measurements vary from trial to trial.
Q6b. What is the average acceleration of the model train?
Background
Topic: Calculating Average Acceleration from Experimental Data
This question asks you to find the average acceleration from several experimental trials, which is a common task in kinematics labs.
Key Terms and Formulas
Average Acceleration: The mean value of all measured accelerations.
Formula:
Step-by-Step Guidance
List all the acceleration values from the table (see image above).
Add up all the acceleration values to get the total sum.
Count the number of trials (N).
Divide the total sum by the number of trials to find the mean acceleration.
Try solving on your own before revealing the answer!
Final Answer:
The average acceleration is the sum of all acceleration values divided by the number of trials. For example, if the values are 0.12, 0.15, 0.13, 0.14, and 0.16 m/s2:
This is the average acceleration of the model train.
Q7a. Create an X vs T graph for the soccer ball. What did you assume about the soccer ball when making the graph?
Background
Topic: Position-Time Graphs from Velocity-Time Data
This question tests your ability to interpret a velocity vs. time (V vs T) graph and use it to construct a position vs. time (X vs T) graph. It also asks you to state any assumptions made in the process.
Key Terms and Formulas
Velocity vs. Time (V vs T) Graph: Shows how velocity changes over time.
Position vs. Time (X vs T) Graph: Shows how position changes over time.
Area under V vs T graph: Represents displacement (change in position).
Formula: (for continuous functions) or sum of areas for piecewise linear graphs.
Step-by-Step Guidance
Examine the V vs T graph for the soccer ball (see image below).
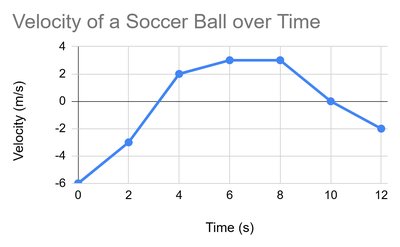
Divide the graph into segments where the velocity is linear or constant.
For each segment, calculate the area under the curve (this gives the change in position for that time interval).
Starting from an initial position (often assumed to be zero), add each segment's displacement to plot the position at each time point.
Assume the soccer ball starts at rest at position zero unless otherwise specified, and that the motion is one-dimensional.
Try solving on your own before revealing the answer!
Final Answer:
The X vs T graph is constructed by calculating the cumulative area under the V vs T graph for each time interval. For example, if the area from 0 to 4 s is positive, the position increases; if the area is negative, the position decreases. The assumption is that the soccer ball starts at position zero and moves in a straight line, with no external forces acting except those shown in the velocity data.
Q7b. Find the distance the soccer ball travels from 3 s to 10 s using the V vs T graph.
Background
Topic: Calculating Distance from Velocity-Time Graphs
This question asks you to use the V vs T graph to determine the total distance traveled (not just displacement) over a specific time interval.
Key Terms and Formulas
Distance: The total length of the path traveled, regardless of direction.
Displacement: The net change in position (can be positive or negative).
Formula: (sum of absolute values of each segment's area under the V vs T graph)
Step-by-Step Guidance
Identify the time interval from 3 s to 10 s on the V vs T graph.
Divide the interval into segments where the velocity is either above or below zero.
For each segment, calculate the area under the curve (treating negative areas as positive for distance).
Add up the absolute values of all these areas to get the total distance traveled.
Try solving on your own before revealing the answer!
Final Answer:
The distance traveled from 3 s to 10 s is the sum of the absolute values of the areas under the V vs T graph between those times. For example, if the areas are +8 m and -6 m, the total distance is 8 m + 6 m = 14 m.
Q7c. Find the displacement of the soccer ball from 3 s to 10 s using the X vs T graph.
Background
Topic: Displacement from Position-Time Graphs
This question asks you to use the X vs T graph to find the net change in position (displacement) over a specific time interval.
Key Terms and Formulas
Displacement: The difference between the final and initial positions.
Formula:
Step-by-Step Guidance
Locate the position of the soccer ball at 3 s and at 10 s on the X vs T graph you created.
Subtract the position at 3 s from the position at 10 s to find the displacement.
Try solving on your own before revealing the answer!
Final Answer:
The displacement from 3 s to 10 s is , where is the position at 10 s and is the position at 3 s, as read from your X vs T graph.
Q7d. Find the displacement of the soccer ball over the whole time using the X vs T graph and the V vs T graph. Compare the values.
Background
Topic: Comparing Displacement Calculated from Different Graphs
This question asks you to find the total displacement over the entire time interval using both the X vs T and V vs T graphs, and to compare the results.
Key Terms and Formulas
Displacement (from X vs T):
Displacement (from V vs T):
Step-by-Step Guidance
From the X vs T graph, find the initial and final positions and subtract to get displacement.
From the V vs T graph, calculate the net area under the curve for the entire time interval (positive and negative areas count with their sign).
Compare the two values to check for consistency (they should be the same if both graphs are accurate).
Try solving on your own before revealing the answer!
Final Answer:
The displacement over the whole time is the difference between the final and initial positions on the X vs T graph, and also the net area under the V vs T graph. Both methods should yield the same value, confirming the consistency of your analysis.
