 뒤로
뒤로Representing Motion and Vectors in Physics
스터디 가이드 - 스마트 노트
 자료에 맞춘 맞춤형 노트, 핵심 정의, 예시, 맥락을 확장해 제공합니다.
Representing Motion
Displacement and Position
Motion in physics is described by the change in position of an object over time. The displacement vector represents the straight-line distance and direction from the starting point to the ending point. Position is often measured relative to a defined origin in a coordinate system.
Displacement is a vector quantity, meaning it has both magnitude and direction.
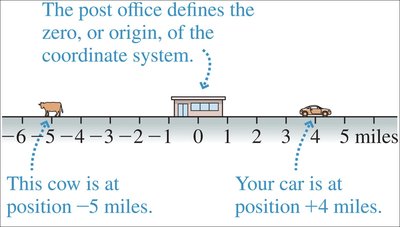
Position is the location of an object relative to a reference point (origin).
Example: If a car moves from position -5 miles to +4 miles, its displacement is 9 miles to the right.
Describing Motion with Position vs. Time Graphs
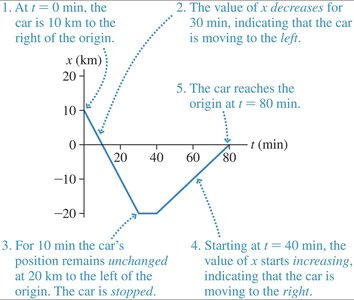
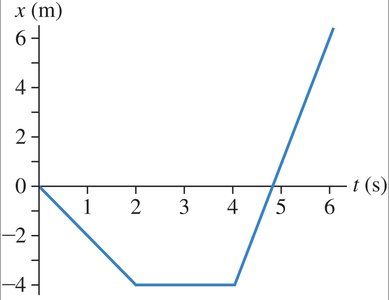
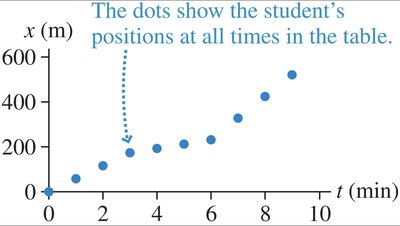
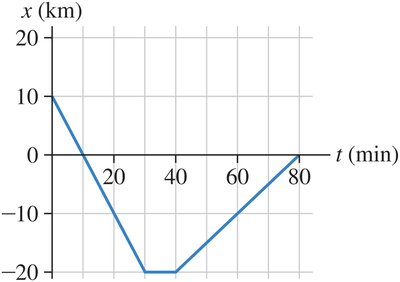
Position vs. time graphs are used to visually represent how an object's position changes over time. The slope of the graph indicates the direction and speed of motion.
A positive slope means movement to the right (increasing position).
A negative slope means movement to the left (decreasing position).
Flat segments indicate the object is stationary.
Turning points show when the object changes direction.
Vectors and Motion in Two Dimensions
Vector Representation and Addition
Vectors are used to represent quantities that have both magnitude and direction, such as displacement, velocity, and force. Vector addition is essential for analyzing motion in two dimensions.
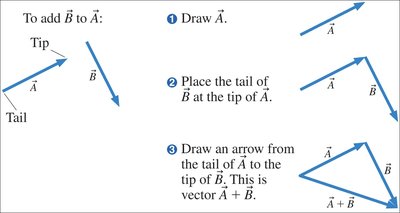
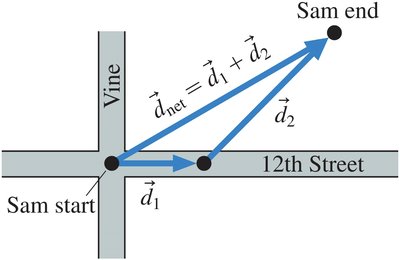
Vector Addition: To add two vectors, place the tail of the second vector at the tip of the first, then draw the resultant vector from the tail of the first to the tip of the second.
Vectors can be added graphically or using components.
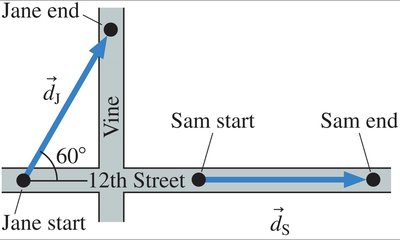
Example: If Jane walks northeast and Sam walks east, their displacement vectors can be added to find the net displacement.
Trigonometry in Vector Analysis
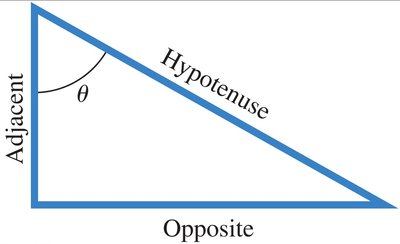
Trigonometry is used to resolve vectors into components and to calculate distances in two-dimensional motion. The relationships between the sides and angles of a right triangle are fundamental for vector calculations.
Sine, cosine, and tangent functions relate the sides of a right triangle to its angles.
To find the magnitude of a vector given its components:
To find the direction:
Example: If a city is 18 km south and 31 km west of another, the straight-line distance is found using the Pythagorean theorem.
Motion in One Dimension
Velocity and Speed
Velocity is a vector quantity describing the rate of change of position, including direction. Speed is the magnitude of velocity and is a scalar quantity.
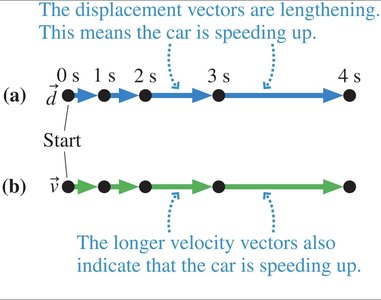
Velocity vector points in the direction of motion and its length represents speed.
Increasing length of velocity vectors indicates speeding up.
Example: A car moving to the left with increasing speed will have velocity vectors pointing left and growing in length.
Position vs. Time Data and Graphs
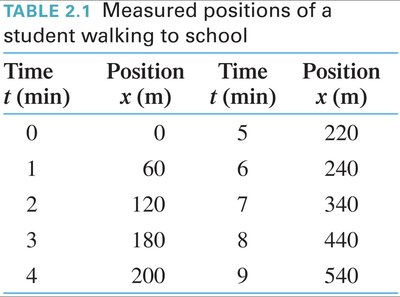
Position vs. time data can be tabulated and graphed to analyze motion. The graph's shape reveals information about speed, direction, and changes in motion.
Linear segments indicate constant speed.
Curved segments indicate changing speed.
Flat segments indicate the object is stationary.
Time t (min) | Position x (m) |
|---|---|
0 | 0 |
1 | 60 |
2 | 120 |
3 | 180 |
4 | 200 |
5 | 220 |
6 | 240 |
7 | 340 |
8 | 440 |
9 | 540 |
Describing Motion with Words
Qualitative Description of Motion
Motion can be described qualitatively by noting where it starts, the direction of movement, whether the object stops, and if it turns around.
Identify the starting position.
Describe the direction of movement (left, right, north, south, etc.).
Note any stops or changes in speed.
Indicate if and when the object turns around.
Summary Table: Types of Motion Representations
Representation | Description | Example |
|---|---|---|
Displacement Vector | Arrow showing change in position | Jane's path on a map |
Position vs Time Graph | Graph showing position at each time | Student walking to school |
Velocity Vector | Arrow showing speed and direction | Car speeding up |
Tabular Data | Table of positions at different times | Measured positions of student |
Key Equations
Displacement:
Velocity:
Pythagorean theorem for distance:
Angle of vector:
Additional info:
Some context and explanations were inferred to ensure completeness and clarity for exam preparation.
