 뒤로
AP Physics 1 Unit 1 Test Review – Step-by-Step Study Guidance
스터디 가이드 - 스마트 노트
 자료에 맞춘 맞춤형 노트, 핵심 정의, 예시, 맥락을 확장해 제공합니다.
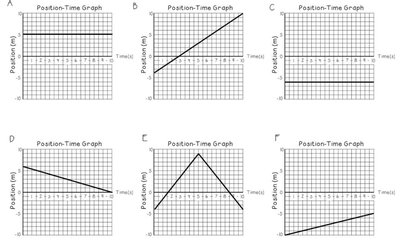
Q1. Using the graphs above, rank the magnitudes of the average velocity from greatest to least.
Background
Topic: Kinematics – Average Velocity
This question tests your understanding of how to interpret position-time graphs and calculate average velocity, which is a fundamental concept in introductory physics.
Key Terms and Formulas:
Average velocity ():
= change in position (displacement)
= change in time (time interval)
Step-by-Step Guidance
Examine each position-time graph and determine the displacement () for the time interval shown.
Calculate the time interval () for each graph (usually the length of the x-axis).
For each graph, use to set up the calculation for average velocity.
Compare the magnitudes (absolute values) of the average velocities for each graph, regardless of direction.
Rank the graphs from greatest to least based on the calculated magnitudes, but stop before actually computing the final values.
Try solving on your own before revealing the answer!
Final Answer:
The ranking from greatest to least magnitude of average velocity is: D > C > B > A.
This is because graph D shows the largest change in position over the time interval, followed by C, B, and A (which has zero displacement).
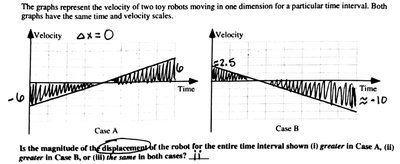
Q2. Is the magnitude of the displacement of the robot for the entire time interval shown (i) greater in Case A, (ii) greater in Case B, or (iii) the same in both cases?
Background
Topic: Kinematics – Displacement from Velocity-Time Graphs
This question tests your ability to interpret velocity-time graphs and determine displacement by calculating the area under the curve.
Key Terms and Formulas:
Displacement (): Area under the velocity-time graph
For constant or linear velocity: (area under the curve)
Step-by-Step Guidance
For each case, identify the shape of the area under the velocity-time graph.
Calculate the area for Case A and Case B (use geometric shapes like triangles and rectangles as needed).
Compare the magnitudes of the areas (displacements) for both cases.
Set up the comparison, but stop before stating which is greater.
Try solving on your own before revealing the answer!
Final Answer:
The magnitude of the displacement is greater in Case B.
Case A has zero net displacement (equal positive and negative areas), while Case B has a net positive area, resulting in greater displacement.
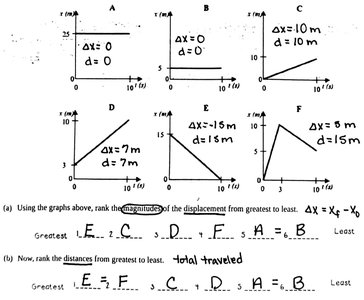
Q3. Using the graphs above, rank the magnitudes of the displacement from greatest to least.
Background
Topic: Kinematics – Displacement from Position-Time Graphs
This question tests your ability to interpret position-time graphs and compare the magnitude of displacement for different scenarios.
Key Terms and Formulas:
Displacement ():
Magnitude: Ignore direction, focus on absolute value
Step-by-Step Guidance
For each graph, identify the initial and final positions ( and ).
Calculate the displacement for each graph using .
Take the absolute value of each displacement to find the magnitude.
Rank the graphs from greatest to least magnitude, but stop before stating the final ranking.
Try solving on your own before revealing the answer!
Final Answer:
The ranking from greatest to least magnitude of displacement is: E = F > C > D > A = B.
Graphs E and F have the largest displacement, followed by C, D, and A/B (which have zero displacement).
