 뒤로
Kinematics: Motion Diagrams, 1D Motion, and Constant Acceleration
스터디 가이드 - 스마트 노트
 자료에 맞춘 맞춤형 노트, 핵심 정의, 예시, 맥락을 확장해 제공합니다.
Motion Diagrams and Kinematic Quantities
Introduction to Motion Diagrams
Motion diagrams are visual tools used to represent the position of an object at successive time intervals. They help in understanding how an object's position changes over time and are foundational for analyzing motion in physics.
Position: The location of an object at a particular instant, usually measured relative to a chosen origin.
Displacement: The change in position of an object, a vector quantity.
Velocity: The rate of change of position with respect to time, including direction (vector).
Speed: The magnitude of velocity, a scalar quantity.
Acceleration: The rate of change of velocity with respect to time (vector).
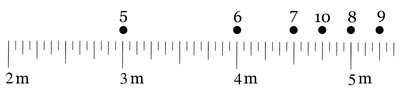
Example: A mouse drops a piece of cheese every second as it moves along a straight line. The positions of the cheese pieces indicate the mouse's position at each second, forming a motion diagram.
1D Motion: Position, Velocity, and Acceleration
Key Kinematic Quantities
In one-dimensional (1D) motion, the following quantities are essential for describing and analyzing motion:
Quantity | Symbol | Type | Description |
|---|---|---|---|
Displacement | \( \Delta x \) | Vector | Change in position |
Velocity (instantaneous) | \( v \) | Vector | Rate and direction of position change |
Speed | \( |v| \) | Scalar | Magnitude of velocity |
Acceleration (instantaneous) | \( a \) | Vector | Rate and direction of velocity change |
Elapsed time | \( \Delta t \) | Scalar | Duration of motion |
Average velocity | \( \bar{v} \) | Vector | Displacement divided by elapsed time |
Example: If a mouse moves from 3 m to 5 m in 2 seconds, its average velocity is \( \frac{5\,\text{m} - 3\,\text{m}}{2\,\text{s}} = 1\,\text{m/s} \).
Kinematic Equations for Constant Acceleration
Equations of Motion
When an object moves with constant acceleration, its position and velocity as functions of time can be described by the kinematic equations. These equations are derived using calculus and are fundamental for solving problems in 1D motion.
First Equation (Velocity as a function of time):
Second Equation (Position as a function of time):
Third Equation (Velocity as a function of displacement):
Where:
\( x_0 \): Initial position
\( v_0 \): Initial velocity
\( a \): Constant acceleration
\( t \): Time elapsed
Example: A motorcycle accelerates from rest (\( v_0 = 0 \)) at \( 4.0\,\text{m/s}^2 \) until it travels 50 m. To find the time to reach 50 m:
Use with , , , .
Instantaneous vs. Average Quantities
Definitions and Differences
It is important to distinguish between average and instantaneous quantities in kinematics:
Average velocity:
Instantaneous velocity:
Average acceleration:
Instantaneous acceleration:
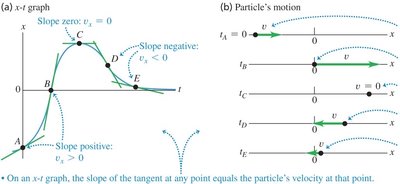
Example: The slope of the tangent to a position-time graph at any point gives the instantaneous velocity at that point.
Analyzing Motion with Diagrams and Graphs
Interpreting Motion Diagrams
Motion diagrams and graphs are used to determine the direction and magnitude of velocity and acceleration at different points in time. The sign of velocity and acceleration can be inferred from the spacing and direction of dots or from the slope of graphs.
If acceleration is positive and velocity is positive, the object speeds up in the positive direction.
If acceleration is negative and velocity is positive, the object slows down.
If acceleration is positive and velocity is negative, the object slows down in the negative direction.
If acceleration is negative and velocity is negative, the object speeds up in the negative direction.
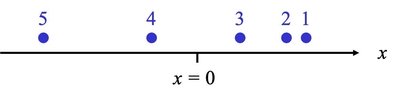
Example: In a motion diagram, if the dots get closer together, the object is slowing down; if they get farther apart, the object is speeding up.
Summary Table: 1D Kinematic Quantities
Quantity | Symbol | Type | What it tells us |
|---|---|---|---|
Displacement | \( \Delta x \) | Vector | Position change |
Elapsed time | \( \Delta t \) | Scalar | Duration |
Average velocity | \( \bar{v} \) | Vector | Average rate and direction of position change |
Instantaneous velocity | \( v \) | Vector | Rate and direction at a specific instant |
Instantaneous acceleration | \( a \) | Vector | Rate and direction of velocity change at a specific instant |
Speed | \( |v| \) | Scalar | Magnitude of velocity |
Additional info: The concepts and equations above are foundational for all subsequent topics in mechanics, including two-dimensional motion, Newton's laws, and energy analysis.
