뒤로
뒤로Physics with Calculus: Representing Motion and Introduction to Vectors
스터디 가이드 - 스마트 노트
 자료에 맞춘 맞춤형 노트, 핵심 정의, 예시, 맥락을 확장해 제공합니다.
Types of Motion
Overview of Motion
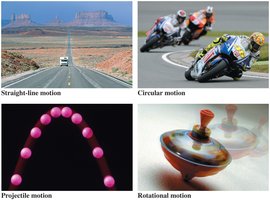
Motion is defined as the change of an object’s position or orientation with time. The path along which an object moves is called its trajectory. There are several fundamental types of motion encountered in physics:
Straight-line motion: Movement along a straight path.
Circular motion: Movement along a circular path.
Projectile motion: Curved path under the influence of gravity.
Rotational motion: Spinning around an axis.
Motion Diagrams
Visualizing Motion in One Dimension
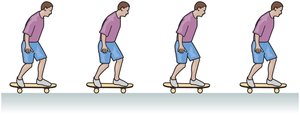
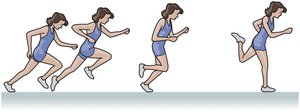
Motion diagrams are sequences of images showing an object’s position at equal time intervals. They help visualize different types of motion:
Constant speed: Equal spacing between positions (e.g., skateboarder).
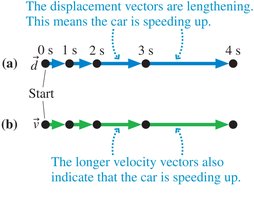
Speeding up: Increasing spacing between positions (e.g., runner).
Slowing down: Decreasing spacing between positions (e.g., car).

Motion in Two Dimensions
Motion diagrams can also represent two-dimensional motion, such as a basketball following a parabolic path (projectile motion):
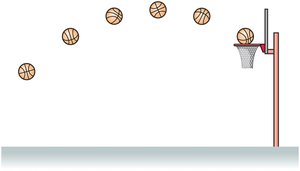
Comparing Speeds Using Motion Diagrams
Relative Speed from Position Spacing
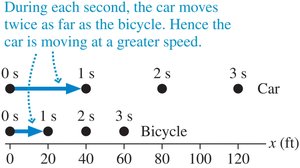
When comparing two objects in motion diagrams, the object with positions spaced farther apart over equal time intervals is moving faster. For example, if Car A’s dots are closer together than Car B’s, Car A is moving slower.


The Particle Model
Simplifying Motion Analysis
The particle model treats a moving object as if all its mass were concentrated at a single point. This simplification allows us to focus on the overall motion without considering the object’s rotation or internal structure.

Position and Coordinate Systems
Defining Position
To specify an object’s position, we need:
A reference point (origin)
A distance from the origin
A direction from the origin
The combination of an origin and an axis marked in both positive and negative directions forms a coordinate system.
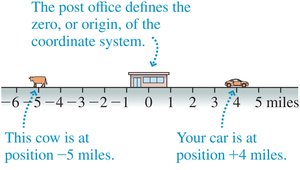
Time and Motion Diagrams
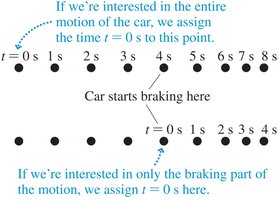
Labeling Time
Each frame in a motion diagram is labeled with its corresponding time (symbol t), as read from a clock. This allows us to analyze how position changes over time.
Displacement and Change in Position
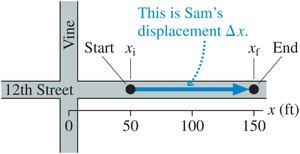
Defining Displacement
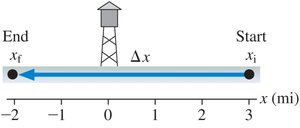
Displacement is the difference between an object’s final position and its initial position:
Displacement is a vector quantity, meaning it has both magnitude and direction.
Time Intervals
Quantifying Motion
A time interval measures the elapsed time as an object moves from an initial position at time ti to a final position at time tf. Time intervals are always positive.
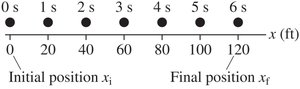
Example: Displacement Calculation
Visualizing Displacement
Consider a cyclist moving along a straight road. By defining a coordinate system and marking initial and final positions, we can calculate displacement as the difference between these positions.
Velocity and Speed
Uniform Motion
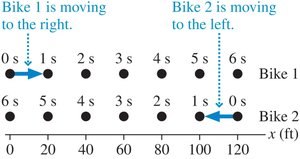
Motion at a constant speed in a straight line is called uniform motion. The velocity of an object includes both its speed and direction, while speed measures only how fast an object moves (scalar quantity).
Example: Calculating Velocity
Application to Real-World Motion
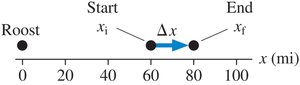
For example, if a seabird moves from 60 miles east to 80 miles east of its roost in 0.25 hours, its average velocity is:
Displacement: 80 mi - 60 mi = 20 mi
Time interval: 0.25 h
Average velocity:
Measurements and Significant Figures
Precision in Measurement
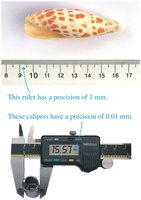
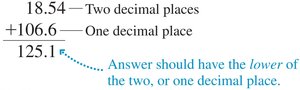
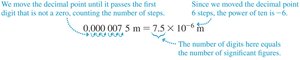
Significant figures reflect the precision of a measurement. When multiplying or dividing, the result should have as many significant figures as the least precise measurement. When adding or subtracting, the result should have as many decimal places as the least precise measurement.

Scientific Notation
Expressing Large and Small Numbers
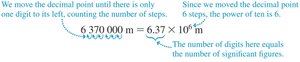
Scientific notation is used to write very large or very small numbers compactly and to clarify the number of significant figures. For example:
SI Units and Metric Prefixes
Standard Units in Science
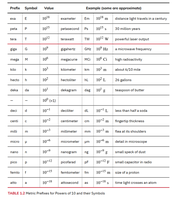
The International System of Units (SI) is used for scientific measurements. Common SI units include meters (m) for length, seconds (s) for time, and kilograms (kg) for mass. Metric prefixes indicate multiples or fractions of units (e.g., kilo-, milli-, micro-).
Vectors and Scalars
Key Differences
A scalar is described by a single number (with a unit), such as temperature or mass. A vector has both magnitude and direction, such as displacement or velocity. Vectors are represented graphically as arrows.

Displacement Vectors
Representing Motion with Vectors
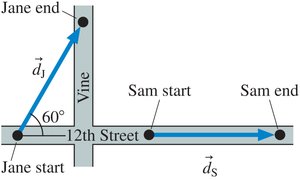
The displacement vector points from the initial position to the final position, regardless of the path taken.
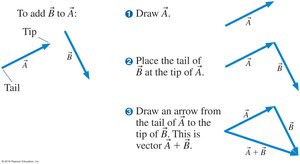
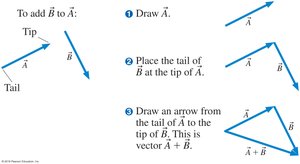
Adding Vectors
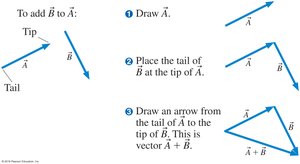
Tip-to-Tail Method
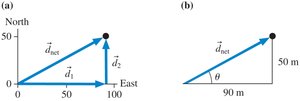
To add vectors, place the tail of the second vector at the tip of the first. The resultant vector is drawn from the tail of the first to the tip of the second.
Vectors and Trigonometry
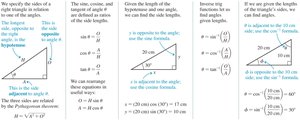
Calculating Components
Trigonometry is used to find the components of vectors. For a vector at angle θ:
Example: Net Displacement Using Vectors
Applying the Pythagorean Theorem
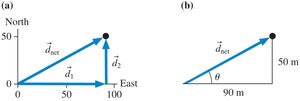
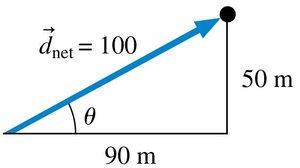
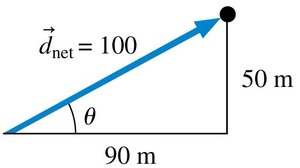
If Anna walks 90 m east and then 50 m north, her net displacement is the hypotenuse of a right triangle:
Direction: north of east
Velocity Vectors
Representing Velocity
The velocity vector points in the direction of motion and its magnitude equals the object’s speed.