 뒤로
Precalculus Exam 2 Review: Step-by-Step Guidance with Visuals
스터디 가이드 - 스마트 노트
 자료에 맞춘 맞춤형 노트, 핵심 정의, 예시, 맥락을 확장해 제공합니다.
Q14. Analyze the following trigonometric functions and their graphs:
Background
Topic: Graphs of Trigonometric Functions (Sine and Cosine)
This question tests your understanding of amplitude, period, phase shift, basic function identification, key points, and graphing transformations for sine and cosine functions.
Key Terms and Formulas:
Amplitude: The maximum value from the midline of the graph. For or , amplitude is .
Period: The length of one complete cycle. For or , period is .
Phase Shift: The horizontal shift, calculated as for or .
Key Points: Standard points on the parent function (e.g., for : ).
Step-by-Step Guidance
Identify the amplitude, period, and phase shift for each function by comparing to the standard form or .
Determine the basic function (sine or cosine) and list the key points for one cycle of the parent function.
Apply the amplitude, period, and phase shift to transform the key points to the new function.
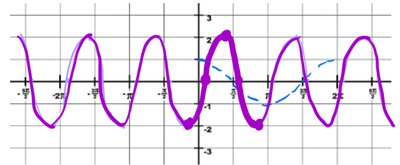
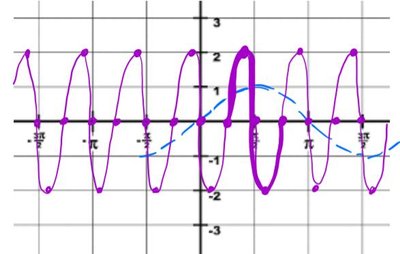
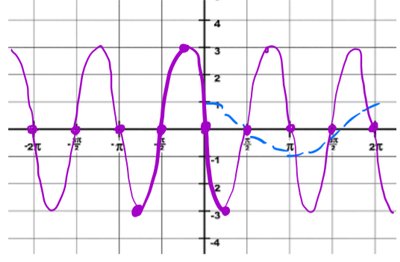
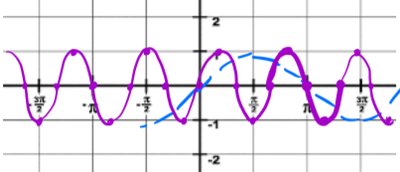
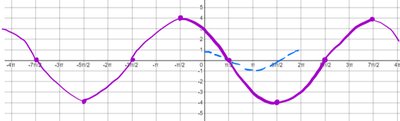
Sketch or analyze the graph for one cycle of the basic function (dashed line) and the transformed function (solid line).
For each part (a–e), match the equation to its corresponding graph by analyzing amplitude, period, and phase shift.
Try solving on your own before revealing the answer!
Final Answer:
a. Amplitude: 2, Period: , Phase shift: Graph:
b. Amplitude: 2, Period: , Phase shift: Graph:
c. Amplitude: 3, Period: , Phase shift: Graph:
d. Amplitude: 1, Period: , Phase shift: Graph:
e. Amplitude: 4, Period: , Phase shift: Graph:
Each graph visually represents the amplitude, period, and phase shift described in the equations above. The dashed line shows the basic function, and the solid line shows the transformed function.
