 뒤로
뒤로Step-by-Step Guidance for Inflation and Trade Cycle Concepts (Macroeconomics)
스터디 가이드 - 스마트 노트
 자료에 맞춘 맞춤형 노트, 핵심 정의, 예시, 맥락을 확장해 제공합니다.
Q1. Explain the Meaning, Features and Definitions of Inflation.
Background
Topic: Inflation (Macroeconomics)
This question tests your understanding of what inflation is, its main characteristics, and how different economists have defined it. Inflation is a core concept in macroeconomics, affecting purchasing power, cost of living, and economic stability.
Key Terms and Concepts:
Inflation: A sustained and general increase in the prices of goods and services in an economy.
Purchasing Power: The value of money in terms of the quantity of goods and services it can buy.
General Price Level: The average of current prices across the entire spectrum of goods and services produced in the economy.
Step-by-Step Guidance
Start by explaining the basic meaning of inflation: a continuous rise in the general price level, not just a one-time increase in the price of a single good.
Discuss how inflation affects the value of money and purchasing power, using an example (e.g., if ₹100 buys fewer goods than before, purchasing power has declined).
Summarize the main features of inflation, such as its general and sustained nature, its impact on purchasing power, and its unequal effects on different groups.
Review the definitions of inflation given by various economists (Pigou, Crowther, Samuelson, Johnson, Friedman), noting the emphasis each places on different aspects (e.g., money income, price level, cost, duration).
Explain the inverse relationship between the value of money and the price level.
Try solving on your own before revealing the answer!
Final Answer:
Inflation is a sustained and general rise in the price level of goods and services in an economy, leading to a fall in the purchasing power of money. Key features include its general and continuous nature, its impact on purchasing power, and its unequal effects on different groups. Economists define inflation as a situation where money income expands more than output (Pigou), where the value of money falls and prices rise (Crowther), or as a sustained rise in prices (Johnson). Milton Friedman described it as 'taxation without representation' because it erodes the real value of money. The relationship between price level and value of money is inverse: as prices rise, the value of money falls.
Q2. Explain the Types of Inflation.
Background
Topic: Types of Inflation
This question examines your ability to classify inflation based on its causes and measurement. Understanding the types of inflation helps in analyzing economic problems and policy responses.
Key Terms:
Demand-Pull Inflation: Caused by excess demand over supply.
Cost-Push Inflation: Caused by rising production costs.
Core Inflation: Excludes volatile items like food and fuel.
Headline Inflation: Includes all items, reflecting the actual price rise faced by consumers.
WPI Inflation: Based on wholesale prices.
CPI Inflation: Based on consumer prices.
Step-by-Step Guidance
List and define the main types of inflation: demand-pull, cost-push, core, headline, WPI, and CPI inflation.
Explain the causes of demand-pull and cost-push inflation, focusing on the role of aggregate demand and supply.
Describe how core and headline inflation differ in terms of what items are included in their calculation.
Clarify the difference between WPI and CPI inflation, and why each is important for economic analysis.
Discuss why classifying inflation is important for policymakers.
Try solving on your own before revealing the answer!
Final Answer:
The main types of inflation are:
Demand-pull inflation (excess demand over supply),
Cost-push inflation (rising production costs),
Core inflation (excluding volatile items),
Headline inflation (all items included),
WPI inflation (wholesale prices),
CPI inflation (consumer prices).
Classifying inflation helps policymakers choose appropriate measures to control it, depending on its cause and impact.
Q3. Explain Demand-Pull Inflation and Its Causes.
Background
Topic: Demand-Pull Inflation
This question focuses on the concept of demand-pull inflation, which arises when aggregate demand exceeds aggregate supply, causing prices to rise.
Key Terms and Diagram:
Aggregate Demand (AD): Total demand for goods and services in the economy.
Aggregate Supply (AS): Total supply of goods and services.
Rightward Shift of AD: Indicates increased demand.
Step-by-Step Guidance
Define demand-pull inflation and explain the basic mechanism: aggregate demand increases faster than aggregate supply.
List the main causes: increase in money supply, deficit financing, credit creation, increase in exports, repayment of public debt, black money, population growth, increase in income, and government expenditure.
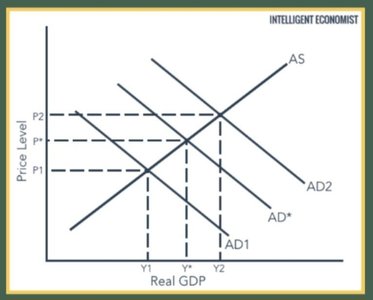
Use the AD-AS diagram to show how a rightward shift in AD (from AD1 to AD2) raises the price level (from P1 to P2).
Explain that in the short run, increased demand may boost output and employment, but once capacity is reached, further demand mainly raises prices.
Discuss possible consequences, such as shortages and black marketing.
Try solving on your own before revealing the answer!
Final Answer:
Demand-pull inflation occurs when aggregate demand increases faster than aggregate supply, causing the general price level to rise. Main causes include increased money supply, deficit financing, easy credit, higher exports, population growth, and increased government spending. The AD-AS diagram shows that a rightward shift in AD leads to higher prices. Once the economy reaches full capacity, further increases in demand mainly result in inflation rather than higher output.
Q4. Explain Cost-Push Inflation and Its Causes.
Background
Topic: Cost-Push Inflation
This question tests your understanding of inflation caused by rising production costs, rather than increased demand.
Key Terms and Diagram:
Cost-Push Inflation: Inflation caused by increased costs of production (wages, raw materials, fuel, etc.).
Aggregate Supply (AS): The total supply of goods and services.
Supply Shock: Sudden increase in input costs or reduction in supply.
Step-by-Step Guidance
Define cost-push inflation and explain how rising production costs (wages, raw materials, fuel, etc.) lead to higher prices.
List the main causes: wage increases, higher material costs, increased profit margins, supply shocks, natural calamities, oil crises, shortages, monopoly power, and exchange-rate changes.
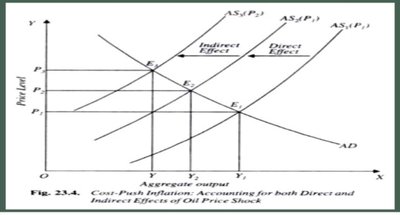
Use the AS-AD diagram to show how a leftward shift in AS (from AS1 to AS2) raises the price level (from P1 to P2) and reduces output (from Y1 to Y2).
Explain that cost-push inflation can lead to stagflation (rising prices with falling output and employment).
Discuss policy measures: increasing production, improving infrastructure, reducing input costs, and preventing artificial shortages.
Try solving on your own before revealing the answer!
Final Answer:
Cost-push inflation is caused by rising production costs, such as higher wages, raw material prices, and supply shocks. The AS-AD diagram shows that a leftward shift in AS increases prices and reduces output. Cost-push inflation can lead to stagflation, where inflation and unemployment rise together. Solutions include increasing production and improving supply conditions.
Q8. Explain the Trade-Off Between Inflation and Unemployment with the Phillips Curve.
Background
Topic: Phillips Curve (Inflation-Unemployment Trade-Off)
This question examines your understanding of the relationship between inflation and unemployment, as illustrated by the Phillips Curve.
Key Terms and Diagram:
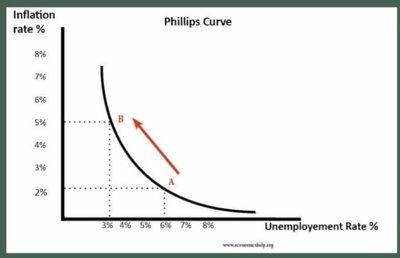
Phillips Curve: Shows the inverse relationship between inflation and unemployment in the short run.
Short-Run vs. Long-Run: In the short run, there is a trade-off; in the long run, the curve becomes vertical.
Step-by-Step Guidance
Describe the Phillips Curve and its implication: as inflation rises, unemployment tends to fall (and vice versa) in the short run.
Explain the economic reasoning: expansionary policies increase demand, leading to higher output, lower unemployment, and higher inflation.
Use the Phillips Curve diagram to show the inverse relationship between inflation and unemployment rates.
Discuss the limitations: in the long run, expectations adjust, and the trade-off may disappear (vertical long-run Phillips Curve).
Mention that supply shocks and stagflation can break the simple inverse relationship.
Try solving on your own before revealing the answer!
Final Answer:
The Phillips Curve shows an inverse relationship between inflation and unemployment in the short run: lower unemployment can be achieved at the cost of higher inflation. In the long run, the curve becomes vertical, indicating no permanent trade-off. Supply shocks and changing expectations can shift the curve, leading to situations like stagflation.
Q13. Explain the Four Phases of a Trade Cycle with the help of a suitable diagram.
Background
Topic: Trade Cycle (Business Cycle)
This question tests your understanding of the recurring phases of economic activity: prosperity, recession, depression, and recovery.
Key Terms and Diagram:
Trade Cycle: Recurring fluctuations in economic activity.
Phases: Prosperity (expansion), Recession, Depression (trough), Recovery (revival).
Step-by-Step Guidance
Define the trade cycle and its four main phases: prosperity, recession, depression, and recovery.
Describe the features of each phase: high output and employment in prosperity, declining activity in recession, low output and high unemployment in depression, and rising activity in recovery.
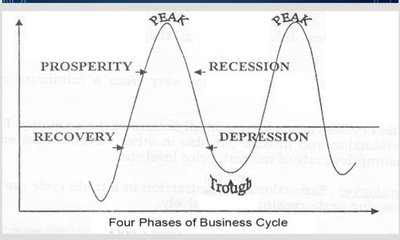
Use the business cycle diagram to illustrate the wave-like movement through these phases.
Explain how the cycle moves from one phase to another, starting from the trough, through recovery and expansion to the peak, then declining through recession and depression.
Discuss the interconnectedness of the phases and how each phase sets the stage for the next.
Try solving on your own before revealing the answer!
Final Answer:
The four phases of a trade cycle are:
Prosperity (expansion/boom): high output, employment, and income;
Recession: declining demand, output, and employment;
Depression (trough): lowest output and employment, falling prices;
Recovery (revival): rising demand, output, and employment.
The business cycle diagram shows these phases as a recurring wave, with the economy moving from trough to peak and back again.
