 뒤로
뒤로Binomial Probability Distributions: Concepts, Notation, and Applications
스터디 가이드 - 스마트 노트
 자료에 맞춘 맞춤형 노트, 핵심 정의, 예시, 맥락을 확장해 제공합니다.
Binomial Probability Distributions
Definition and Requirements
A binomial probability distribution describes the probability of obtaining a fixed number of successes in a fixed number of independent trials, where each trial has only two possible outcomes: success or failure. For a probability distribution to be classified as binomial, the following four requirements must be met:
Fixed Number of Trials: The experiment consists of a set number of trials, denoted by n.
Independence: The outcome of any individual trial does not affect the outcomes of the other trials.
Two Categories: Each trial results in one of two outcomes, commonly labeled as "success" (S) and "failure" (F).
Constant Probability: The probability of success, p, remains the same for each trial.
Notation for Binomial Probability Distributions
Standard notation is used to describe binomial probability distributions:
S and F: Denote the two possible outcomes (success and failure).
p: Probability of success in a single trial.
q: Probability of failure in a single trial, where q = 1 - p.
n: The fixed number of trials.
x: The specific number of successes in n trials (where x can be any integer from 0 to n).
P(x): Probability of getting exactly x successes in n trials.
Binomial Probability Formula
The probability of obtaining exactly x successes in n independent trials is given by the binomial probability formula:
n! denotes the factorial of n.
p is the probability of success in a single trial.
q is the probability of failure in a single trial.
Finding Binomial Probabilities Using Excel
Excel provides the BINOM.DIST function to calculate binomial probabilities efficiently. The syntax is:
=BINOM.DIST(x, n, p, cumulative)
If cumulative is FALSE (or 0), it returns the probability of exactly x successes.
If cumulative is TRUE (or 1), it returns the probability of up to and including x successes.
Applications and Examples
Example 1: Probability of Knowing Twitter
Suppose the probability that a randomly selected adult knows what Twitter is equals 0.85. If five adults are selected at random, what is the probability that exactly three of them know what Twitter is?
Given: n = 5, p = 0.85, q = 0.15, x = 3
Using Excel: =BINOM.DIST(3, 5, 0.85, 0)
Result: P(3) = 0.138178
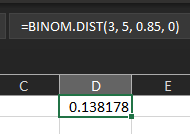
Interpretation: There is approximately a 13.8% chance that exactly three out of five randomly selected adults know what Twitter is.
Example 2: Overtime Rule in Football
Between 1974 and 2011, 460 NFL games were decided in overtime, and 252 were won by the team that won the coin toss. Is this result likely due to chance?
Given: n = 460, p = 0.5, x = 252
We want the probability of 252 or more wins: P(X \geq 252)
Using Excel: =1 - BINOM.DIST(251, 460, 0.5, 1)
Result: P(X \geq 252) = 0.022429
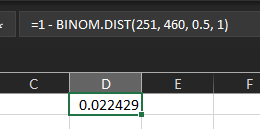
Interpretation: The probability of observing 252 or more wins by chance is about 2.2%, which is less than 5%. This suggests the result is unlikely due to random chance, indicating a possible advantage for the team winning the coin toss.
Example 3: Belief in the Devil
Suppose 60% of adults believe in the devil. If five adults are randomly selected, find:
(a) The probability that exactly three believe in the devil.
(b) The probability that at least two believe in the devil.
Part (a):
Given: n = 5, p = 0.6, x = 3
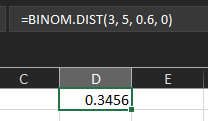
Using Excel: =BINOM.DIST(3, 5, 0.6, 0)
Result: P(3) = 0.3456
Part (b):
We want the probability that at least two believe: P(X \geq 2)
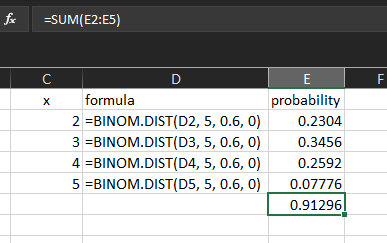
Sum probabilities for x = 2, 3, 4, 5:
x | formula | probability |
|---|---|---|
2 | =BINOM.DIST(2, 5, 0.6, 0) | 0.2304 |
3 | =BINOM.DIST(3, 5, 0.6, 0) | 0.3456 |
4 | =BINOM.DIST(4, 5, 0.6, 0) | 0.2592 |
5 | =BINOM.DIST(5, 5, 0.6, 0) | 0.07776 |
Sum: P(X \geq 2) = 0.91296
Alternative Calculation: Use =1-BINOM.DIST(1, 5, 0.6, 1) to find the probability of 0 or 1 believing, then subtract from 1.
Summary Table: Binomial Probability Distribution Notation
Symbol | Meaning |
|---|---|
n | Number of trials |
x | Number of successes in n trials |
p | Probability of success in a single trial |
q | Probability of failure in a single trial (q = 1 - p) |
P(x) | Probability of exactly x successes in n trials |
Key Takeaways
Binomial probability distributions model the number of successes in a fixed number of independent trials with two possible outcomes per trial.
Excel's BINOM.DIST function is a practical tool for calculating binomial probabilities, especially for large sample sizes.
Understanding the requirements and notation is essential for correctly applying the binomial model to real-world problems.
