 뒤로
Central Limit Theorem and Sampling Distributions: Study Guide
스터디 가이드 - 스마트 노트
 자료에 맞춘 맞춤형 노트, 핵심 정의, 예시, 맥락을 확장해 제공합니다.
Central Limit Theorem
Definition and Importance
The Central Limit Theorem (CLT) is a fundamental concept in statistics that describes the behavior of the sampling distribution of the sample mean. It states that for all samples of the same size n with n > 30, the sampling distribution of the mean (\( \bar{x} \)) can be approximated by a normal distribution, regardless of the shape of the original population distribution.
Population Distribution: Can be any shape (normal, skewed, uniform, etc.)
Sample Size Requirement: The sample size must be greater than 30, or the population itself must be normally distributed.
Sampling Distribution: The distribution of sample means from repeated samples of size n.
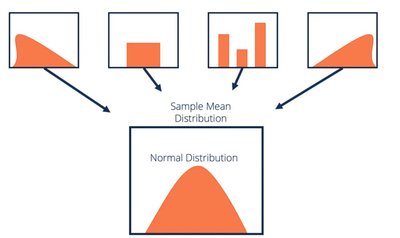
Key Point: As sample size increases, the distribution of sample means approaches a normal distribution, even if the original population is not normal.
Mathematical Properties
Mean of Sample Means: The mean of all values of \( \bar{x} \) is equal to the population mean \( \mu \).
Standard Deviation of Sample Means (Standard Error): The standard deviation of all values of \( \bar{x} \) is called the standard error of the mean (SEM).
Z-score for Sample Mean: To find probabilities related to sample means, use:
Z-score for Individual Value: For a single value from a normal population:
Requirements for Using the CLT
The population must be normally distributed or the sample size must be greater than 30.
If the population is not normal and n ≤ 30, the CLT does not apply, and normal approximation is not valid.
Practical Problem Solving with the CLT
Steps and Considerations
Check Requirements: Confirm that the sample size is large enough or the population is normal.
Distinguish Between Individual and Sample Mean: Use the appropriate formula for z-score depending on whether you are working with a single value or a sample mean.
Standard Error: Always use \( \sigma / \sqrt{n} \) for the standard deviation when working with sample means.
Notation for Sampling Distribution
Symbols and Terminology
\( \mu_{\bar{x}} \): Mean of all sample means (equals population mean \( \mu \)).
\( \sigma_{\bar{x}} \): Standard deviation of all sample means (standard error).
SEM: Standard Error of the Mean, another term for \( \sigma_{\bar{x}} \).
Examples and Applications
Example 1: Pulse Rates
Population: Female pulse rates, \( \mu = 77 \) bpm, \( \sigma = 12.0 \) bpm.
a) Individual Probability: Probability that a randomly selected female has a pulse rate less than 83 bpm. Use
b) Sample Mean Probability: Probability that the mean pulse rate of 9 females is less than 83 bpm. Use
Example 2: Elevator Safety
Scenario: 16 adult male passengers, mean weight limit 160 lb.
Population: Male weights, \( \mu = 165 \) lb, \( \sigma = 31 \) lb.
Question: Probability that the mean weight of 16 passengers exceeds 160 lb.
Application: Use CLT to assess safety based on sample mean.
Example 3: Overhead Reach Distances
Population: Female overhead reach, \( \mu = 204 \) cm, \( \sigma = 8.5 \) cm.
a) Individual Probability: Probability that a single distance is greater than 216 cm.
b) Sample Mean Probability: Probability that the mean of 23 distances is greater than 216 cm.
c) CLT Applicability: Normal distribution can be used for sample mean because the population is normal, even though n does not exceed 30.
Example 4: Aircraft Seat Design
Population: Male hip widths, \( \mu = 14.3 \) in., \( \sigma = 0.9 \) in.
a) Individual Probability: Probability that a randomly selected male has a hip width greater than 16.0 in.
b) Sample Mean Probability: Probability that the mean hip width of 126 males exceeds 16.0 in.
c) Design Relevance: The sample mean is more relevant for seat design, as it reflects the average space needed for all passengers. Results suggest caution in reducing seat width.
Summary Table: CLT Formulas and Requirements
Situation | Formula | Requirement |
|---|---|---|
Individual Value | Population must be normal | |
Sample Mean | Population normal or n > 30 | |
Standard Error | For sample means |
