 뒤로
Chapter 1: Data Collection – Introductory Statistics Study Notes
스터디 가이드 - 스마트 노트
 자료에 맞춘 맞춤형 노트, 핵심 정의, 예시, 맥락을 확장해 제공합니다.
Data Collection in Statistics
Introduction to the Practice of Statistics
Statistics is the science of collecting, organizing, summarizing, and analyzing information to draw conclusions or answer questions. It also involves providing a measure of confidence in any conclusions. The information used in statistics is called data, which describes characteristics of individuals.
Statistics: The science of data analysis for decision-making.
Statistical Thinking: Involves understanding variability and uncertainty in data.
Data: Facts or propositions used to draw conclusions or make decisions.
The Process of Statistics
The process of statistics involves several key steps to ensure valid and reliable results:
Population: The entire group of individuals to be studied.
Sample: A subset of the population selected for study.
Individual: A single member of the population.
Parameter: A numerical summary of a population.
Statistic: A numerical summary based on a sample.
Descriptive Statistics: Organizing and summarizing data using tables, graphs, and numerical summaries.
Inferential Statistics: Methods that use sample results to make generalizations about a population and measure reliability.
Example: If 48.2% of all students own a car (parameter), but a sample of 100 students shows 46% own a car (statistic).
The four-step process of statistics:
Identify the research objective.
Collect the data needed to answer the question(s).
Describe the data.
Perform inference (draw conclusions).
Example: Pew Research poll on trust in neighbors: surveyed 1628 adults, 52% trusted neighbors, margin of error 2.5%.
Types of Variables
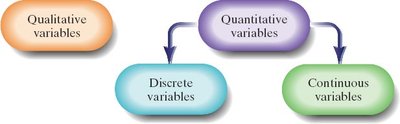
Variables are characteristics of individuals in a population. They can be classified as qualitative or quantitative, and further as discrete or continuous.
Qualitative (Categorical) Variables: Classify individuals based on attributes or characteristics.
Quantitative Variables: Provide numerical measures; arithmetic operations are meaningful.
Discrete Variables: Quantitative variables with a finite or countable number of values.
Continuous Variables: Quantitative variables with infinite possible values, measurable to any desired accuracy.
Example:
Gender – Qualitative
Temperature – Quantitative (Continuous)
Number of study days – Quantitative (Discrete)
Zip code – Qualitative
Discrete variables result from counting; continuous variables are measured.
Levels of Measurement
Variables can be measured at different levels, which determine the types of statistical analyses that are appropriate:
Nominal: Values name, label, or categorize; no ranking.
Ordinal: Values can be ranked; differences between values are not meaningful.
Interval: Values can be ranked; differences are meaningful; zero does not mean absence of quantity.
Ratio: Values can be ranked; differences and ratios are meaningful; zero means absence of quantity.
Example:
Gender – Nominal
Letter grade – Ordinal
Temperature – Interval
Number of study days – Ratio
Observational Studies Versus Designed Experiments
Observational Studies and Experiments
Research can be conducted using observational studies or designed experiments. The distinction is important for interpreting results.
Observational Study: Measures the value of the response variable without influencing variables.
Designed Experiment: Researcher assigns groups, manipulates explanatory variables, and records response.
Example: Studying cell phone use and brain tumors in humans (observational) vs. rats (experiment).
Response Variable: The outcome measured (e.g., incidence of brain tumors).
Explanatory Variable: The variable manipulated or observed for its effect (e.g., cell phone usage).
Observational studies can show association, not causation. Designed experiments can establish causation if confounding variables are controlled.
Confounding: Effects of two or more explanatory variables are not separated.
Lurking Variable: Not considered in the study but affects the response variable.
Types of Observational Studies
Cross-sectional Studies: Collect information at a specific point in time.
Case-control Studies: Retrospective; compare individuals with and without certain characteristics.
Cohort Studies: Prospective; follow a group over time and record characteristics.
Census Data and Web Scraping
Census: List of all individuals in a population with their characteristics.
Web Scraping: Extracting data from the Internet; important in data science but raises ethical issues.
Sampling Methods
Simple Random Sampling
Simple random sampling ensures every possible sample of size n from a population of size N has an equal chance of being selected.
Random Sampling: Using chance to select individuals.
Frame: List of all individuals in the population.
Seed: Initial point for random number generation.
Example: Selecting 3 friends from 6 for a concert; each possible group has equal probability.
Other Effective Sampling Methods
Several sampling methods are used to improve representativeness and efficiency:
Stratified Sampling: Divide population into homogeneous strata, then sample from each stratum.
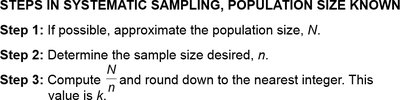
Systematic Sampling: Select every kth individual from the population, starting at a random point.
Cluster Sampling: Divide population into groups (clusters), randomly select clusters, and survey all individuals in selected clusters.
Convenience Sampling: Individuals are easily obtained; results are often unreliable.
Multistage Sampling: Combination of sampling techniques, often used in large-scale surveys.
Bias in Sampling
Sources of Bias
If a sample is not representative of the population, it is biased. Three main sources of bias are:
Sampling Bias: Technique favors one part of the population; undercoverage is a common cause.
Nonresponse Bias: Individuals who do not respond differ from those who do; can be reduced with callbacks or incentives.
Response Bias: Survey answers do not reflect true feelings; caused by interviewer error, misrepresented answers, question wording, order, or type.
Data-entry Error: Mistakes in recording data can lead to inaccurate results; data should be checked for accuracy.
Nonsampling Error: Errors from bias or data-entry mistakes; can occur even in a census.
Sampling Error: Error from using a sample to estimate population information; occurs because samples provide incomplete information.
Summary Table: Sampling Methods Comparison
Sampling Method | Description | Example |
|---|---|---|
Simple Random | Every sample has equal chance | Randomly select 5 clients from 30 |
Stratified | Divide into strata, sample from each | Sample resident, nonresident, staff |
Systematic | Select every kth individual | Survey every 7th customer |
Cluster | Randomly select clusters, survey all in cluster | Survey all households in 20 city blocks |
Convenience | Sample easily obtained individuals | Survey people at a mall |
Key Formulas
Systematic Sampling: To determine k, use:
Additional info: These notes expand on brief points from the original slides and textbook, providing definitions, examples, and context for each concept. Images included are directly relevant to the explanation of sampling methods, variable classification, and bias.
