뒤로

Chapter 2: Data Description – Essential Concepts and Applications

학습 가이드 - 영상으로 배우기

업로드한 자료에 맞춘 엄선된 수업 – 모든 주제를 단계별로 배워보세요.

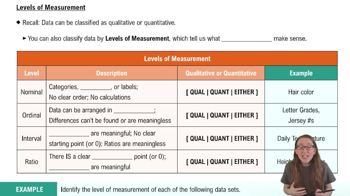
Levels of Measurement

  • 가이드 코스
    Levels of Measurement
    06:52
  • 가이드 코스
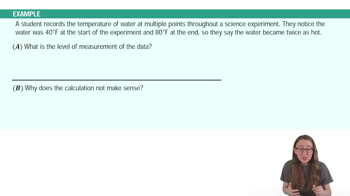
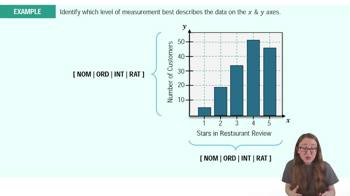
    Levels of Measurement Example 1
    02:46
  • 가이드 코스
    Levels of Measurement Example 2
    02:46

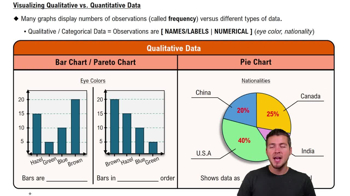
Visualizing Qualitative vs. Quantitative Data

  • 가이드 코스
    Visualizing Qualitative vs. Quantitative Data
    04:39

Frequency Distributions

  • 가이드 코스
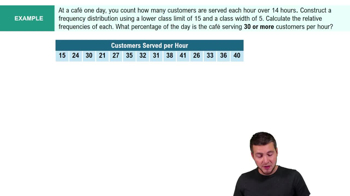
    Intro to Frequency Distributions Example 1
    06:19
  • 가이드 코스
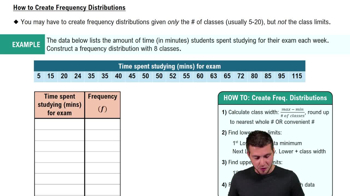
    How to Create Frequency Distributions
    06:29
  • 가이드 코스
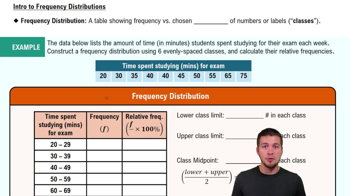
    Intro to Frequency Distributions
    06:38

Bar Graphs and Pareto Charts

  • 가이드 코스
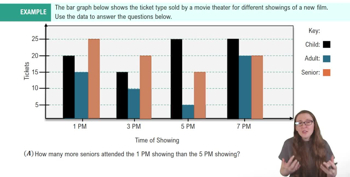
    Bar Graphs and Pareto Charts Example 1
    05:26
  • 가이드 코스
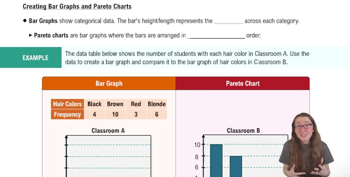
    Creating Bar Graphs and Pareto Charts
    04:52

Boxplots

  • 가이드 코스
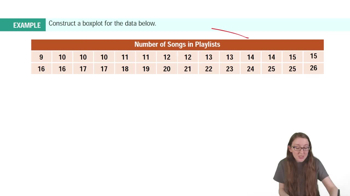
    Boxplots Example 1
    01:52
  • 가이드 코스
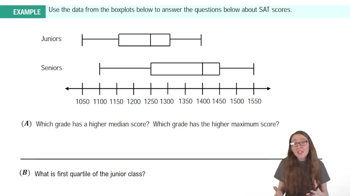
    Boxplots Example 2
    02:48
  • 가이드 코스
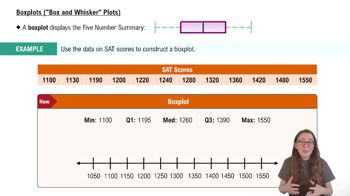
    Boxplots ("Box and Whisker Plots")
    03:54

Mean

  • 가이드 코스
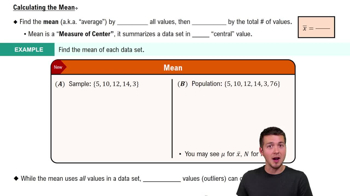
    Calculating the Mean
    04:52
  • 가이드 코스
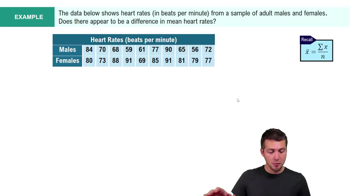
     Calculating the Mean Example 1
    03:08

Median

  • 가이드 코스
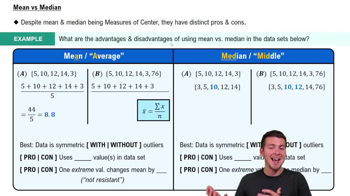
    Comparing Mean vs. Median
    04:48
  • 가이드 코스
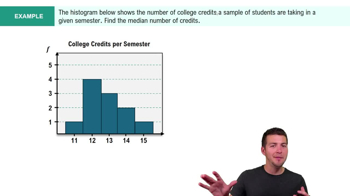
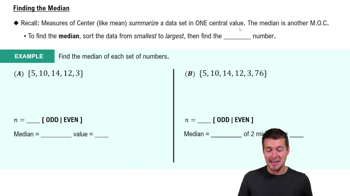
    Calculating the Median Example 1
    02:35
  • 가이드 코스
    Calculating the Median
    03:26

Standard Deviation

  • 가이드 코스
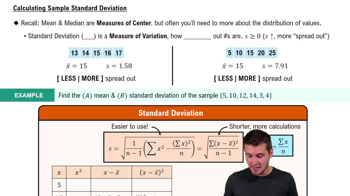
    Calculating Standard Deviation
    08:45
  • 가이드 코스
    Calculating Standard Deviation Example 1
    02:59

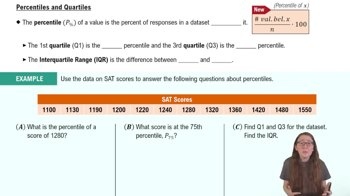
Percentiles & Quartiles

  • 가이드 코스
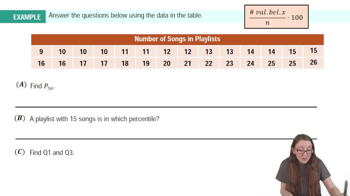
    Percentiles and Quartiles Example 1
    04:30
  • 가이드 코스
    Percentiles and Quartiles
    07:11

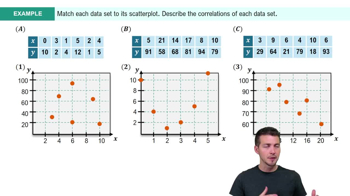
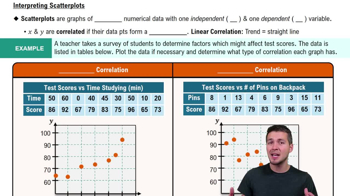
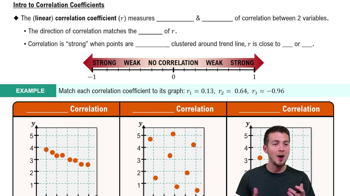
Scatterplots & Intro to Correlation

  • 가이드 코스
    Scatterplots & Intro to Correlation Example 1
    05:14
  • 가이드 코스
    Scatterplots & Intro to Correlation
    06:36
  • 가이드 코스
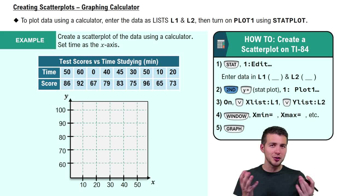
    Creating Scatterplots - Graphing Calculator
    05:26

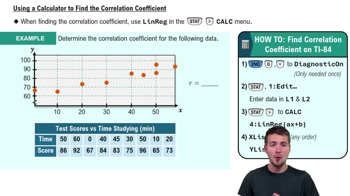
Correlation Coefficient

  • 가이드 코스
    Correlation Coefficient
    05:43
  • 가이드 코스
    Calculating Correlation Coefficient - Graphing Calculator
    04:40
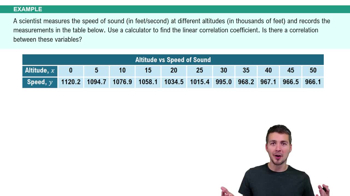
  • 가이드 코스
    Calculating Correlation Coefficient - Graphing Calculator Example 1
    03:44

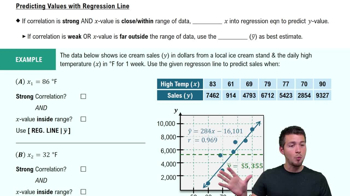
Linear Regression & Least Squares Method

  • 가이드 코스
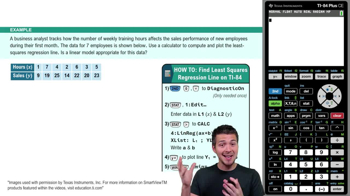
    Using Regression Lines to Predict Values
    04:57
  • 가이드 코스
    Intro to Least Squares Regression Example 1
    05:02
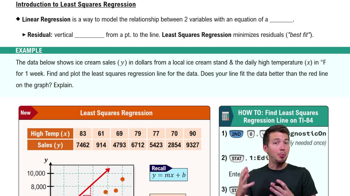
  • 가이드 코스
    Intro to Least Squares Regression
    07:01

Residuals

  • 가이드 코스
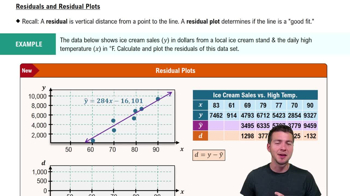
    Residuals and Residual Plots
    07:38