 뒤로
Correlation and Regression: Study Notes for Introductory Statistics
스터디 가이드 - 스마트 노트
 자료에 맞춘 맞춤형 노트, 핵심 정의, 예시, 맥락을 확장해 제공합니다.
Correlation and Regression
Section 9.1: Correlation
Correlation is a fundamental concept in statistics that describes the relationship between two variables. Understanding correlation helps us determine whether changes in one variable are associated with changes in another. This section covers the types of correlation, how to calculate the correlation coefficient, and how to test its significance.
Definition and Types of Correlation
Correlation: A relationship between two variables, represented by ordered pairs (x, y).
Independent Variable (x): Also called the explanatory variable; plotted on the horizontal axis.
Dependent Variable (y): Also called the response variable; plotted on the vertical axis.
Scatter Plot: A graphical representation of ordered pairs (x, y) to visually assess the relationship.
Types of correlation observed in scatter plots:
Positive Linear Correlation: As x increases, y increases.
Negative Linear Correlation: As x increases, y decreases.
No Correlation: No discernible relationship between x and y.
Nonlinear Correlation: Relationship exists but is not linear.
Examples of Scatter Plots
GDP and CO2 Emissions: Positive linear correlation; as GDP increases, CO2 emissions tend to increase.
Exercise Hours and GPA: No linear correlation; exercise hours do not appear related to GPA.
Geyser Eruptions: Positive linear correlation; longer eruption durations are associated with longer times until the next eruption.
Correlation Coefficient
The correlation coefficient (r) measures the strength and direction of a linear relationship between two variables.
Sample Correlation Coefficient (r): Calculated from sample data.
Population Correlation Coefficient (\rho): Represents the true correlation in the population.
Range:
Interpretation:
r = 1: Perfect positive correlation
r = -1: Perfect negative correlation
r = 0: No linear correlation
Values closer to 1 or -1 indicate stronger correlation
Formula for Correlation Coefficient
The formula for the sample correlation coefficient is:
where n is the number of data pairs.
Example: Calculating the Correlation Coefficient
For GDP and CO2 emissions data, a strong positive linear correlation was found.
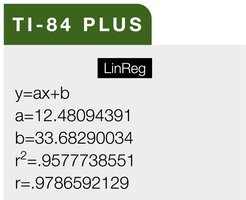
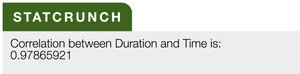
For geyser eruption data, technology tools (Excel, TI-84 Plus, StatCrunch) calculated r ≈ 0.9787, indicating a strong positive correlation.

Testing the Significance of the Correlation Coefficient
After calculating r, it is important to determine if the correlation is statistically significant. This can be done using critical values from a table or by performing a hypothesis test.
Critical Value Table: Compare the calculated r to the critical value for the given sample size and significance level.
If is greater than the critical value, the correlation is significant.
Hypothesis Testing for the Population Correlation Coefficient
A hypothesis test can be used to determine if the sample correlation coefficient provides enough evidence to conclude that the population correlation coefficient is significant.
Null Hypothesis (H0): (no correlation)
Alternative Hypothesis (H1): (correlation exists)
Test can be one-tailed or two-tailed.
The t-Test for the Correlation Coefficient
The t-test is used to test the significance of the correlation coefficient. The test statistic is:
where n is the number of pairs of data. The t-distribution has (n - 2) degrees of freedom.
If t falls in the rejection region, the null hypothesis is rejected, indicating significant correlation.
Correlation vs. Causation
It is important to distinguish between correlation and causation. A strong correlation does not necessarily imply a cause-and-effect relationship.
Direct Cause-and-Effect: x causes y.
Reverse Cause-and-Effect: y causes x.
Lurking Variables: Other variables not included in the study may influence the relationship.
Coincidence: The relationship may be due to chance.
Lurking variables are variables that affect the studied variables but are not included in the analysis.
Summary Table: Types of Correlation
Type | r Value | Description |
|---|---|---|
Perfect Positive | 1 | All points lie exactly on a line with positive slope |
Strong Positive | 0.81 | Points closely follow a line with positive slope |
Weak Positive | 0.45 | Points loosely follow a line with positive slope |
No Correlation | 0.04 | No discernible linear relationship |
Strong Negative | -0.81 | Points closely follow a line with negative slope |
Perfect Negative | -1 | All points lie exactly on a line with negative slope |
Additional info: Academic context was added to clarify the formulas, hypothesis testing, and the distinction between correlation and causation. The summary table was inferred from the text and standard statistics knowledge.
