뒤로
뒤로Discrete Probability Distributions: Binomial, Poisson, and Hypergeometric
스터디 가이드 - 스마트 노트
 자료에 맞춘 맞춤형 노트, 핵심 정의, 예시, 맥락을 확장해 제공합니다.
Discrete Probability Distributions
Introduction to Discrete Probability Distributions
Discrete probability distributions describe the probabilities of outcomes for discrete random variables, which take on whole number values. These distributions are foundational in statistics for modeling countable outcomes, such as the number of successes in a series of trials.
Discrete Data: Values are integers, usually counted (e.g., number of complaints per day).
Continuous Data: Values can take any value within a range, often measured (e.g., temperature, time).
Probability Distributions
Probability distributions can be classified as discrete or continuous. Discrete probability distributions are covered in this chapter, while continuous distributions are addressed separately.
Discrete Probability Distribution: Lists all possible outcomes for a discrete random variable and their probabilities.
Continuous Probability Distribution: Describes probabilities for continuous random variables.
Rules for Discrete Probability Distributions
Each outcome must be mutually exclusive.
Probabilities must satisfy: for all .
The sum of all probabilities must be 1: .
Example: Probability Distribution for Coin Tosses
Consider tossing two coins and counting the number of heads. The probability distribution is:
# Heads (x) | Probability P(x) |
|---|---|
0 | 0.25 |
1 | 0.50 |
2 | 0.25 |
Mean, Variance, and Standard Deviation of a Discrete Probability Distribution
Mean (Expected Value):
Variance:
Standard Deviation:
For the coin toss example, the mean number of heads is 1.00, variance is 0.50, and standard deviation is approximately 0.707.
Comparing Distributions
The mean and standard deviation are useful for comparing different probability distributions. For example, comparing the number of rings before a call is answered at two call centers:
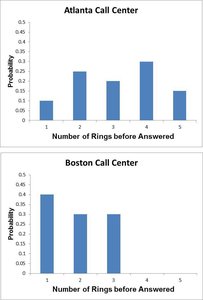
The Boston call center has a lower mean (faster answering) and is more consistent (lower standard deviation).
Expected Monetary Value (EMV)
The EMV is the mean of a discrete probability distribution when outcomes are measured in monetary terms. It represents the long-term average value if the experiment is repeated many times.
Binomial Distributions
Characteristics of a Binomial Experiment
Fixed number of trials ()
Each trial has two possible outcomes: success or failure
Probability of success () and failure () are constant
Trials are independent
Examples: Survey responses (yes/no), defective/acceptable items, job offer acceptance/rejection.
Binomial Probability Formula
The probability of exactly successes in trials is:
= number of trials
= number of successes
= probability of success
= probability of failure ()
Example: Binomial Probability Calculation
Suppose 40% of voters support Proposition A. In a sample of 10 voters, what is the probability exactly 5 support it?
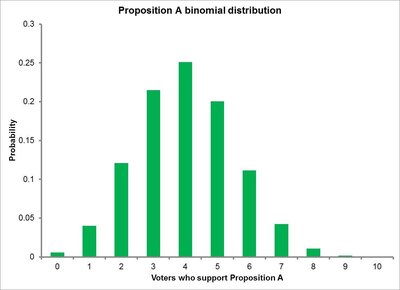
Mean and Standard Deviation of a Binomial Distribution
Mean:
Standard Deviation:
For , mean is 4, standard deviation is approximately 1.549.
Using Binomial Probability Tables and Software
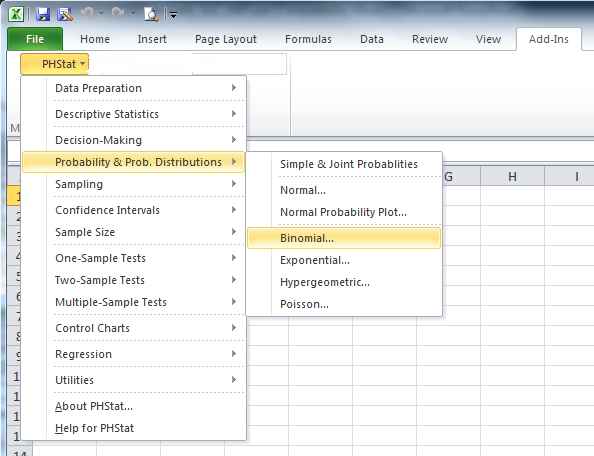
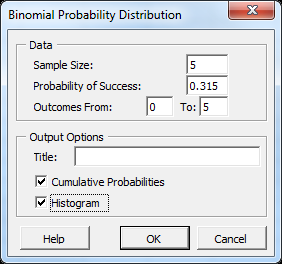
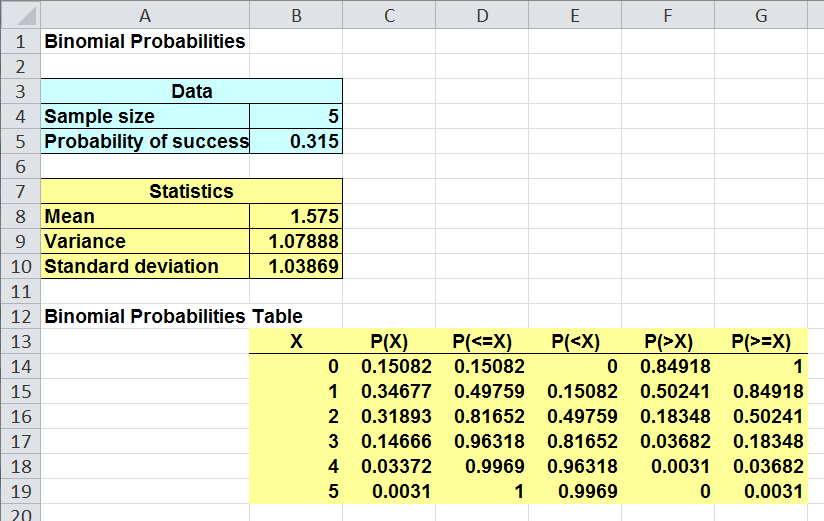
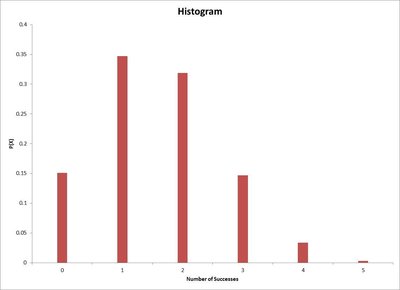
Binomial probabilities can be found using tables or software such as Excel or PHStat.
Excel: =BINOM.DIST(x, n, p, cumulative)
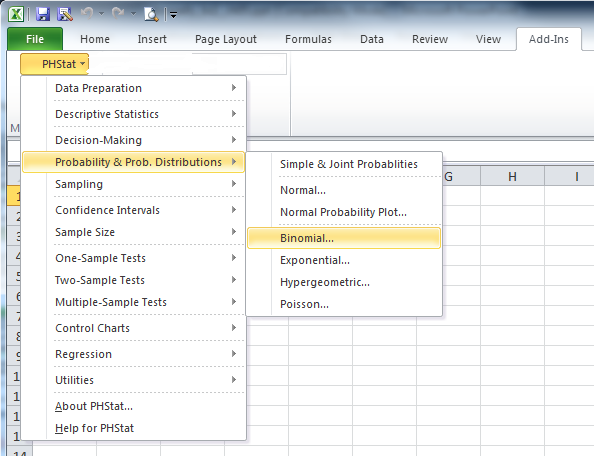
PHStat: Menu navigation to Binomial Probability Distribution
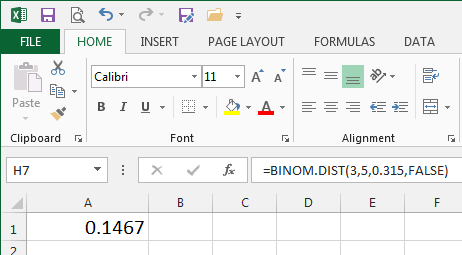
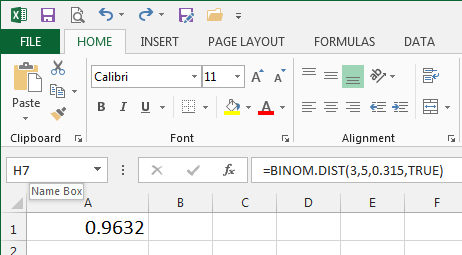
Poisson Distributions
Characteristics of a Poisson Process
Counts the number of occurrences of an event over a fixed interval (time, area, etc.)
The mean number of occurrences () is constant for each interval
Occurrences in different intervals are independent
Intervals do not overlap
Examples: Number of customers per hour, flaws per meter of cloth, accidents per month.
Poisson Probability Formula
The probability of exactly occurrences in an interval is:
= mean number of occurrences
The variance of a Poisson distribution is equal to its mean:
Example: Poisson Probability Calculation
If a bank receives an average of 4 bad checks per week, what is the probability it receives exactly 3 next week?
Using Poisson Probability Tables and Software
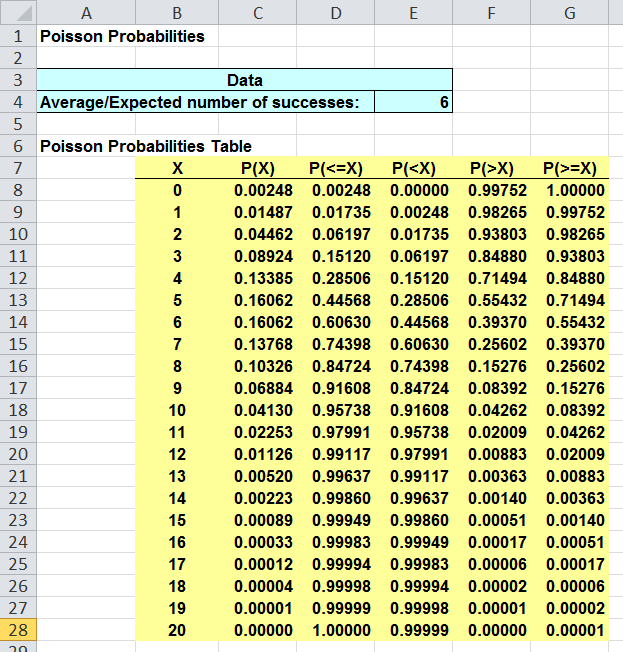
Poisson probabilities can be found using tables or software such as Excel or PHStat.
Excel: =POISSON.DIST(x, \lambda, cumulative)
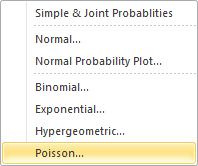
PHStat: Menu navigation to Poisson Probability Distribution
Poisson Approximation to the Binomial
The Poisson distribution can approximate the binomial distribution when and . The approximation is:
The Hypergeometric Distribution
Characteristics and Formula
The hypergeometric distribution is used when sampling is done without replacement from a finite population, making the trials dependent.
The probability of successes in a sample of size from a population of size with successes is:
= population size
= number of successes in population
= sample size
= number of successes in sample

Example: Hypergeometric Probability Calculation
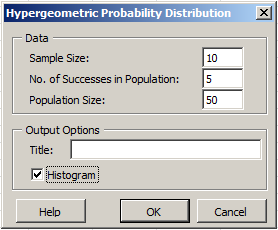
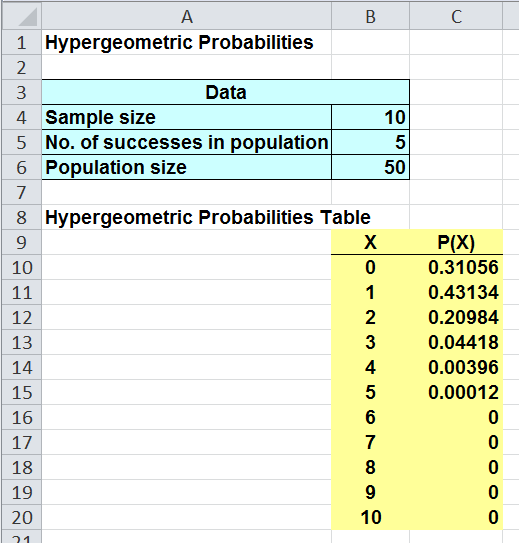
Suppose 5 of 50 accounts are delinquent. If 10 accounts are sampled without replacement, what is the probability at least one is delinquent?
Find
, so
Mean and Standard Deviation of the Hypergeometric Distribution
Mean:
Standard Deviation:
Using Hypergeometric Probability Tables and Software
Hypergeometric probabilities can be calculated using Excel or PHStat.
Excel: =HYPGEOM.DIST(x, n, R, N, cumulative)
PHStat: Menu navigation to Hypergeometric Probability Distribution