 뒤로
Discrete Probability Distributions: Binomial, Poisson, Expected Value, and Risk
스터디 가이드 - 스마트 노트
 자료에 맞춘 맞춤형 노트, 핵심 정의, 예시, 맥락을 확장해 제공합니다.
Discrete Probability Distributions
Introduction to Discrete Probability Distributions
Discrete probability distributions are fundamental tools in statistics for modeling count-based outcomes in business and science. They provide a compact description of uncertainty, allowing decision-makers to understand not only what may happen, but how likely each outcome is.
Discrete distributions model count outcomes (e.g., number of defects, late invoices).
Continuous distributions model measurement outcomes (e.g., delivery time, weight).
Discrete vs Continuous Variables
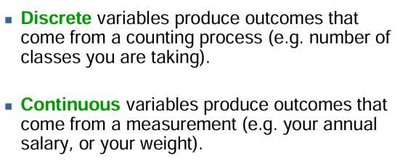
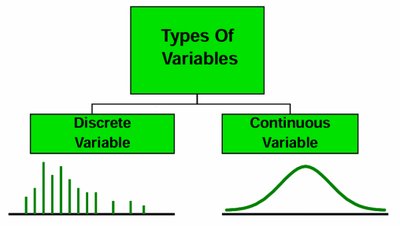
The first modeling choice in statistics is to determine whether the variable of interest is discrete or continuous.
Discrete variable: Produced by a counting process; possible values are separated (e.g., 0, 1, 2, 3...).
Continuous variable: Produced by a measurement process; possible values can be any value in an interval.
Probability Distributions
Definition and Requirements
A probability distribution lists all possible values of a random variable and attaches a probability to each one.
Each probability must be between 0 and 1.
All probabilities must sum to 1.
Example: Probability Distribution Table
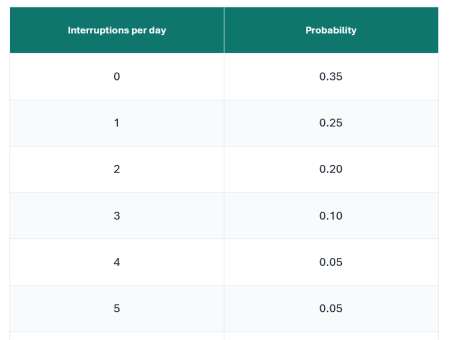
The table below shows the probability distribution for the number of network interruptions per day:
Interruptions per day | Probability |
|---|---|
0 | 0.35 |
1 | 0.25 |
2 | 0.20 |
3 | 0.10 |
4 | 0.05 |
5 | 0.05 |
Expected Value and Risk
Expected Value (Mean) of a Discrete Variable
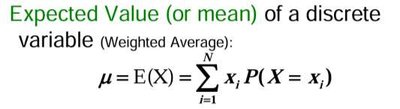
The expected value, or mean, of a discrete random variable is the long-run average outcome, calculated as a weighted average using probabilities.
Formula:
Multiply each outcome by its probability, then sum the products.
Useful for forecasting and resource planning.
Variance and Standard Deviation
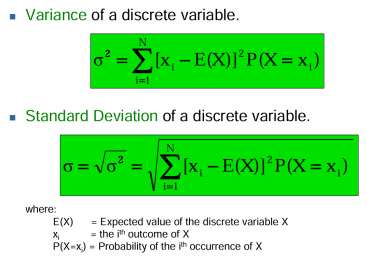
Variance and standard deviation measure the dispersion or risk around the expected value.
Variance: Weighted average of squared deviations from the expected value.
Standard deviation: Square root of variance; gives a risk scale in units of the random variable.
Formulas:
Variance:
Standard Deviation:
Counting Rules
Combinations
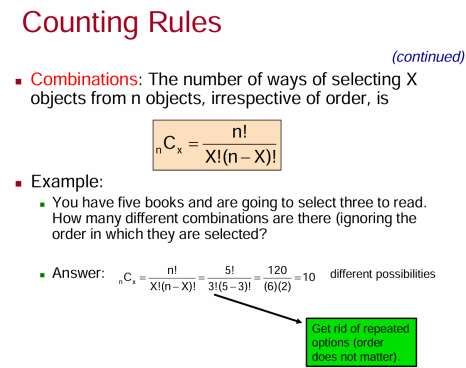
Combinations are used to count the number of ways to select X objects from n objects, irrespective of order.
Formula:
Order does not matter; repeated options are eliminated.
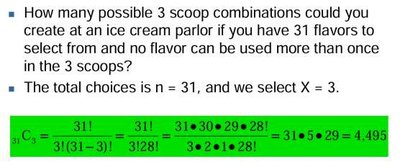
Example: Ice Cream Scoop Combinations
31 flavors, select 3 scoops:
Result: 4,495 possible combinations.
Binomial Distribution
Definition and Formula
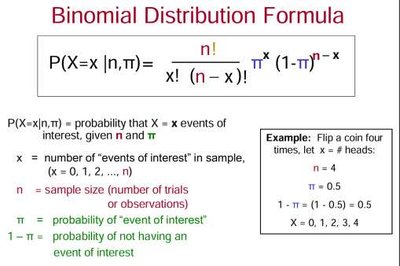
The binomial distribution models the number of successes in a fixed number of independent yes/no trials, each with the same probability of success.
Formula:
n = number of trials, x = number of successes, = probability of success
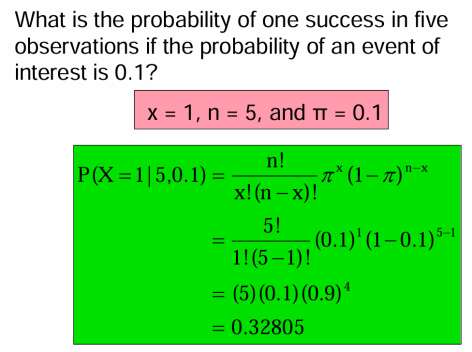
Example: Probability of One Success in Five Trials
x = 1, n = 5, = 0.1
Calculation:
Mean, Variance, and Standard Deviation of Binomial Distribution
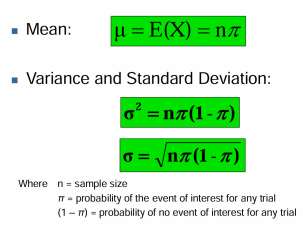
Mean:
Variance:
Standard Deviation:
Poisson Distribution
Definition and Formula
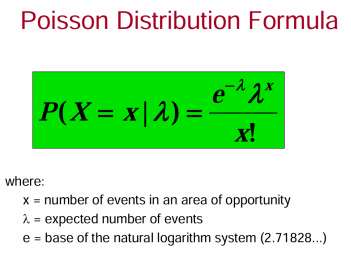
The Poisson distribution models the number of events occurring in a fixed interval of time or space, given a constant average rate .
Formula:
x = number of events, = expected number of events, e = base of natural logarithm
Mean, Variance, and Standard Deviation of Poisson Distribution
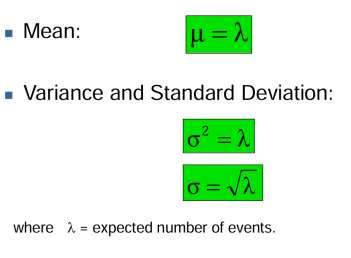
Mean:
Variance:
Standard Deviation:
Summary Table: Binomial vs Poisson Distributions
Distribution | What is counted? | Key parameter(s) | Example |
|---|---|---|---|
Binomial | Successes in fixed trials | n and p | Late invoices among 20 invoices |
Poisson | Events in an interval/opportunity | λ | Late invoices arriving per day |
Final Takeaways
Discrete distributions model count outcomes.
Expected value summarizes the center; standard deviation summarizes risk.
Binomial models successes in fixed repeated yes/no trials.
Poisson models event counts per time, space, or opportunity.
SPSS and Excel calculate quickly, but managers must choose the model and interpret results.
Additional info:
All formulas are provided in LaTeX format for clarity and academic rigor.
Tables and images are included only when directly relevant to the explanation of the paragraph.
