 뒤로
Introductory Statistics Exam 1 Study Guide: Chapters 1–4
스터디 가이드 - 스마트 노트
 자료에 맞춘 맞춤형 노트, 핵심 정의, 예시, 맥락을 확장해 제공합니다.
Chapter 1: Introduction to Data & Study Design
What is Statistics?
Statistics is the science of collecting, organizing, analyzing, and interpreting data to draw conclusions. It helps us make informed decisions based on evidence rather than guesses.
Collecting data: Gathering information from populations or samples.
Organizing data: Structuring data for analysis.
Analyzing data: Using statistical methods to summarize and interpret data.
Interpreting data: Drawing conclusions and making predictions.
Population vs Sample
Understanding the difference between population and sample is fundamental in statistics.
Population: The entire group of interest (e.g., all college students).
Sample: A subset of the population selected for study (e.g., 100 surveyed students).
Census: Collecting data from every member of the population.
Variables
A variable is a characteristic measured on individuals or objects. Variables are classified as qualitative (categorical) or quantitative (numerical).
Categorical (Qualitative) Variables: Describe qualities or categories (e.g., eye color, gender).
Numerical (Quantitative) Variables: Describe quantities obtained through counting or measuring (e.g., height, weight).
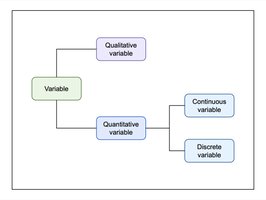
Subtypes of Quantitative Variables
Discrete Variables: Counted values (e.g., number of pets).
Continuous Variables: Measured values (e.g., height, weight).
Descriptive vs Inferential Statistics
Descriptive Statistics: Summarize and organize data (mean, median, graphs).
Inferential Statistics: Use sample data to make conclusions about a population.
Types of Studies
Observational Study: Researchers observe subjects without assigning treatments. Can show association but not causation.
Experiment: Researchers assign treatments to subjects. Can establish causation.
Sampling Methods
Simple Random Sample: Every member has an equal chance of selection.
Stratified Sample: Divide population into groups (strata), then randomly sample from each.
Cluster Sample: Divide population into clusters, randomly select clusters, and sample everyone in selected clusters.
Systematic Sample: Select every nth individual.
Convenience Sample: Select individuals easiest to reach; often biased.
Chapter 2: Picturing Variation with Graphs
Describing Distributions
Graphical methods help visualize data and identify patterns. Key features to describe:
Shape: Symmetric, skewed right, skewed left.
Center: Typical value (mean or median).
Variability (Spread): How spread out the data are.
Outliers: Unusual observations.
Graphs for Numerical Data
Dotplot: Best for small datasets.
Stemplot: Shows original values.
Histogram: Best for larger datasets; bars touch, shows frequency.
Graphs for Categorical Data
Bar Chart: Most common for categorical data; bars separated.
Pie Chart: Shows percentages as slices of a circle.
Pareto Chart: Bar chart arranged largest to smallest.
Distribution Shapes
Symmetric: Mean ≈ Median.
Skewed Right: Tail points right; Mean > Median.
Skewed Left: Tail points left; Mean < Median.
Modes
Unimodal: One peak.
Bimodal: Two peaks.
Multimodal: Three or more peaks.
Chapter 3: Numerical Summaries of Center and Variation
Measures of Center
Mean (x̄): Arithmetic average.
Median: Middle value when data are ordered.
Mean vs Median
Statistic | Resistant? |
|---|---|
Mean | No |
Median | Yes |
Measures of Spread
Range:
Variance (s²): Square of standard deviation.
Standard Deviation (s): Measures typical distance from the mean.
Interquartile Range (IQR):
Quartiles and Five-Number Summary
Q1: 25th percentile
Q2: Median (50th percentile)
Q3: 75th percentile
Five-Number Summary: Minimum, Q1, Median, Q3, Maximum
Boxplots
Boxplots display the five-number summary and show center, spread, skewness, and outliers.
Outlier Detection
Lower Fence:
Upper Fence:
Values outside the fences are considered outliers.
Empirical Rule (68-95-99.7 Rule)
For bell-shaped distributions:
Within 1 SD: 68% of data
Within 2 SD: 95% of data
Within 3 SD: 99.7% of data
Z-Score
Formula:
Interpretation: Positive z = above mean; Negative z = below mean
Chapter 4: Regression Analysis – Exploring Associations Between Variables
Scatterplots
Scatterplots are used to study relationships between two numerical variables. Always describe trend, strength, shape, and outliers.
Positive Trend: As x increases, y increases.
Negative Trend: As x increases, y decreases.
No Association: No pattern.
Correlation (r)
Measures strength and direction of a linear relationship.
Range:
Interpretation: +1 = perfect positive, 0 = no linear relationship, -1 = perfect negative
Regression Equation
Formula:
Where is the predicted value, is the intercept, is the slope.
Slope Interpretation
Positive slope: For every 1-unit increase in x, y increases by slope units.
Negative slope: For every 1-unit increase in x, y decreases by slope units.
Residual
Formula:
Interpretation: Positive residual = actual > predicted; Negative residual = actual < predicted
Coefficient of Determination (R²)
Formula:
Interpretation: Percent of variation explained by the model
Extrapolation
Making predictions outside the observed data range is risky and should be avoided.
Summary Table: Variable Types
Type | Description | Examples |
|---|---|---|
Categorical (Qualitative) | Labels or groups | Eye color, gender |
Numerical (Quantitative) | Numbers with mathematical meaning | Height, weight |
Discrete | Counted values | Number of pets |
Continuous | Measured values | Height, weight |
Exam Preparation Tips
Master the differences between population vs sample, categorical vs numerical, discrete vs continuous, descriptive vs inferential, and observational vs experimental studies.
Be able to describe distributions using shape, center, spread, and outliers.
Know how to calculate and interpret mean, median, standard deviation, IQR, z-scores, correlation, regression equations, and R².
Understand the risks of extrapolation and the difference between association and causation.
Additional info: The included image visually reinforces the classification of variables, directly supporting the explanation of variable types and their subcategories.
