 뒤로
Introductory Statistics Exam 2 Review – Step-by-Step Study Guidance
스터디 가이드 - 스마트 노트
 자료에 맞춘 맞춤형 노트, 핵심 정의, 예시, 맥락을 확장해 제공합니다.
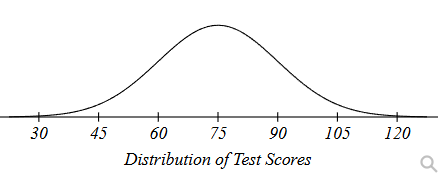
Q5. What is the mean and standard deviation of this distribution?
Background
Topic: Descriptive Statistics & Normal Distribution
This question is testing your ability to interpret a normal distribution graph and identify the mean and standard deviation from the visual representation of test scores.
Key Terms:
Mean (): The central value of the distribution, often located at the peak of the bell curve.
Standard Deviation (): A measure of spread; it determines how far values typically fall from the mean.
Step-by-Step Guidance
Examine the graph and locate the center of the distribution. The mean () is typically at the highest point of the curve.
Identify the values on the x-axis that correspond to the mean. Look for the value at the center of the distribution.
To estimate the standard deviation (), observe the spacing between the dashed lines (if present) or the spread of the curve. In a normal distribution, standard deviation marks the distance from the mean to the points where the curve changes curvature.
Check the x-axis labels for evenly spaced values, which may indicate standard deviation intervals (e.g., mean ± 1, mean ± 2$\sigma$).
Set up your answer by identifying the mean and estimating the standard deviation based on the graph's features.
Try solving on your own before revealing the answer!
Final Answer:
The mean of the distribution is approximately 75, and the standard deviation is about 15.
These values are determined by observing the center of the curve (mean) and the spacing between the tick marks on the x-axis (standard deviation).
Q6. Express the distribution of in proper statistical notation.
Background
Topic: Statistical Notation for Normal Distributions
This question is testing your ability to write the distribution of a variable in standard notation, which is essential for communicating statistical results.
Key Terms:
Normal Distribution Notation: , where is the mean and is the standard deviation.
Step-by-Step Guidance
Recall the standard notation for a normal distribution: .
From the previous question, use the mean and standard deviation values you identified.
Substitute the mean and standard deviation into the notation.
Write the final expression for the distribution of using the values from the graph.
Try solving on your own before revealing the answer!
Final Answer:
The distribution of is:
This means that is normally distributed with a mean of 75 and a standard deviation of 15.
