Intro to Stats
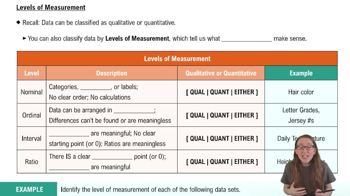
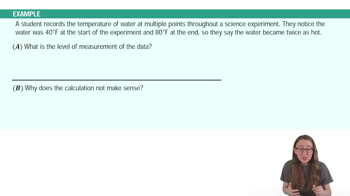
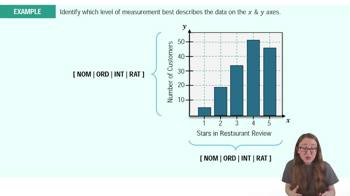
Levels of Measurement
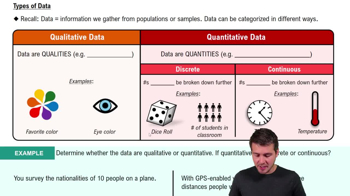
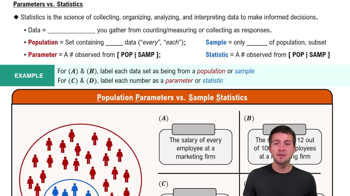
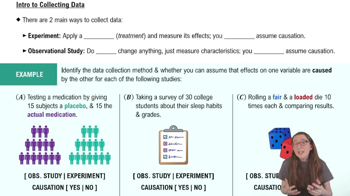
Intro to Collecting Data
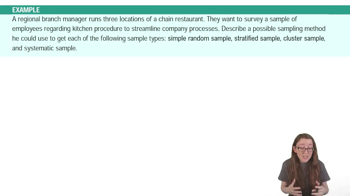
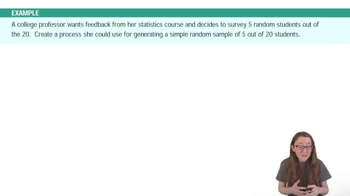
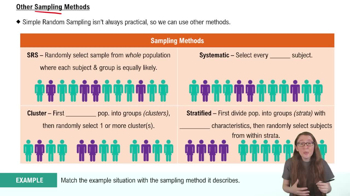
Sampling Methods
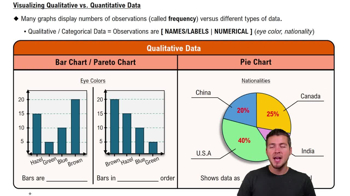
Visualizing Qualitative vs. Quantitative Data
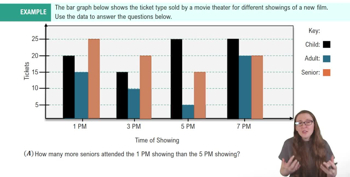
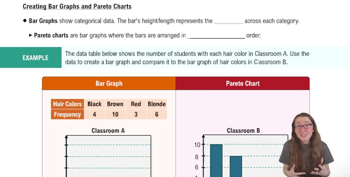
Bar Graphs and Pareto Charts
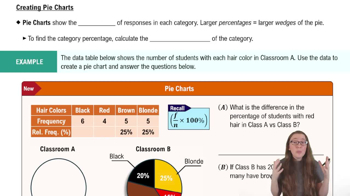
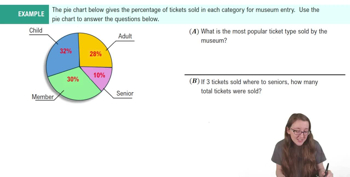
Pie Charts
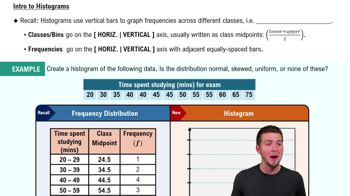
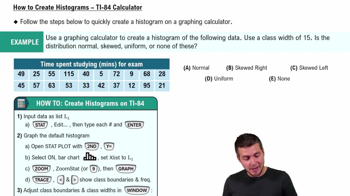
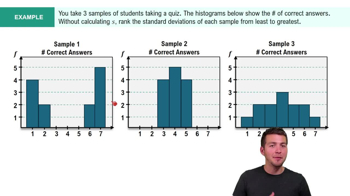
Histograms
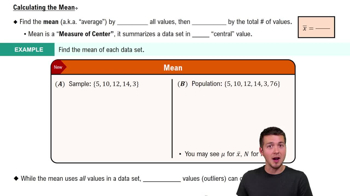
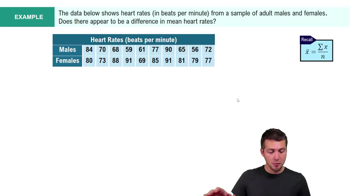
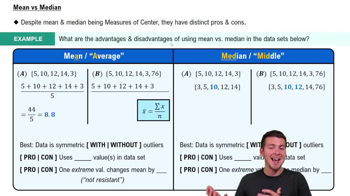
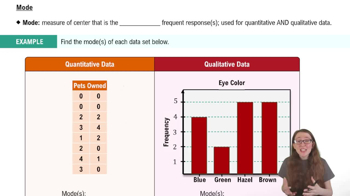
Mean
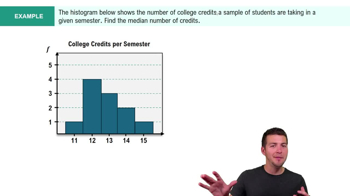
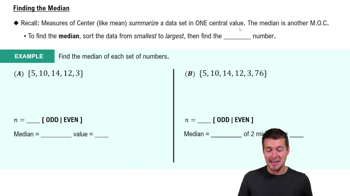
Median
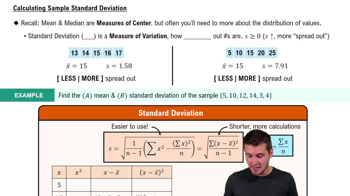
Standard Deviation
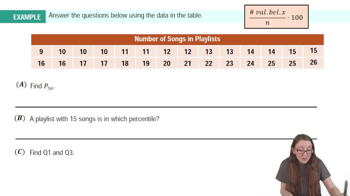
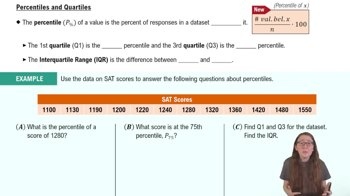
Percentiles & Quartiles
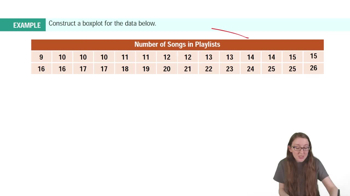
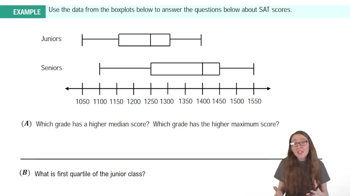
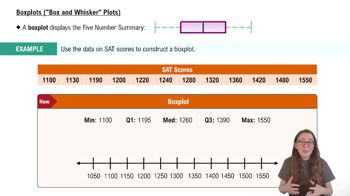
Boxplots
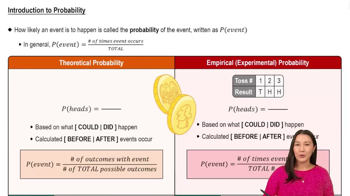
Basic Concepts of Probability
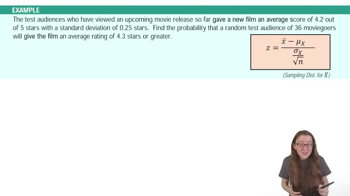
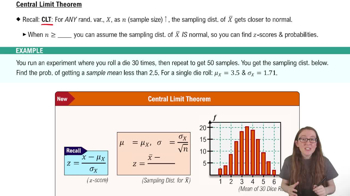
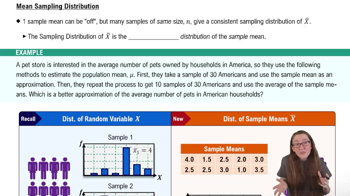
Sampling Distribution of the Sample Mean and Central Limit Theorem
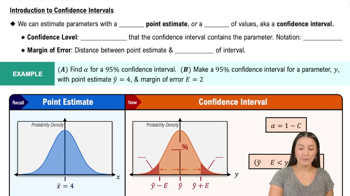
Introduction to Confidence Intervals
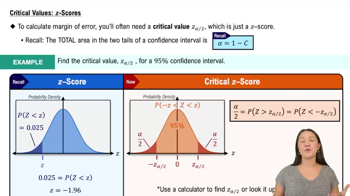
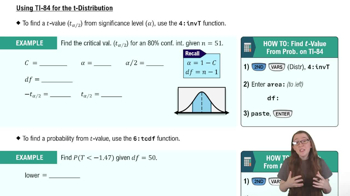
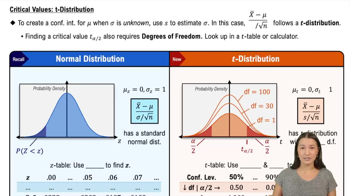
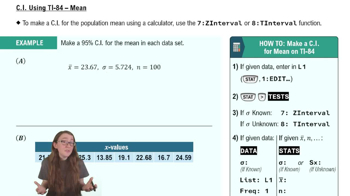
Confidence Intervals for Population Mean
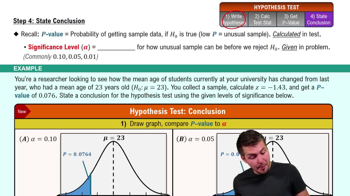
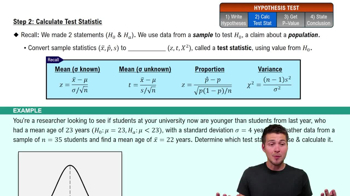
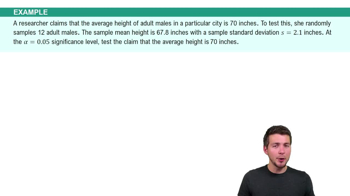
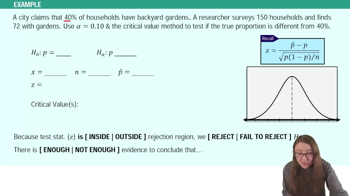
Steps in Hypothesis Testing
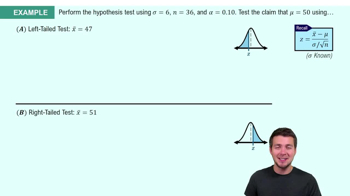
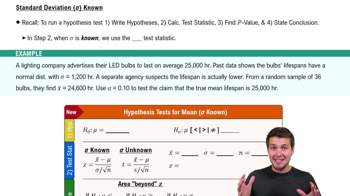
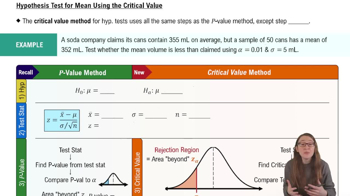
Performing Hypothesis Tests: Means
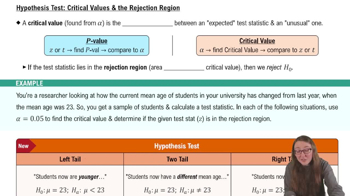
Critical Values and Rejection Regions
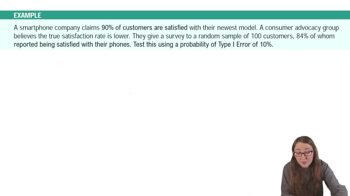
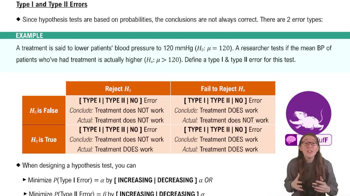
Type I & Type II Errors
 뒤로
 업로드한 자료에 맞춘 엄선된 수업 – 모든 주제를 단계별로 배워보세요.
 04:24