Intro to Stats
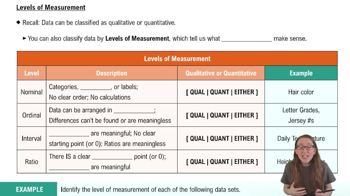
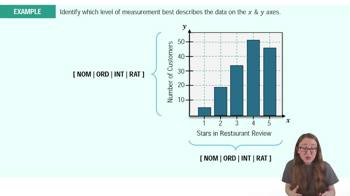
Levels of Measurement
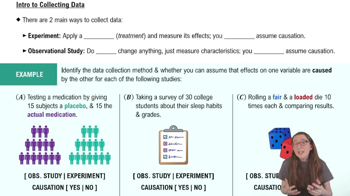
Intro to Collecting Data
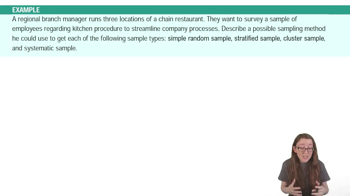
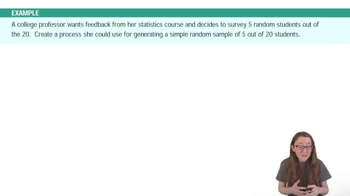
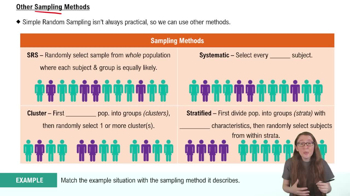
Sampling Methods
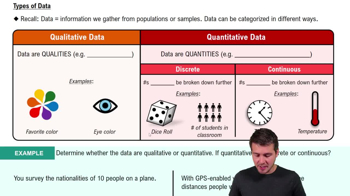
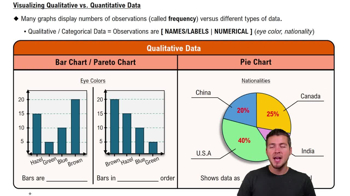
Visualizing Qualitative vs. Quantitative Data
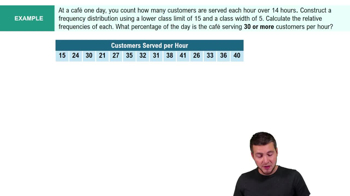
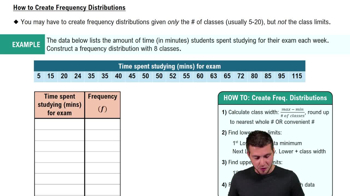
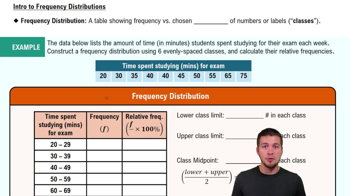
Frequency Distributions
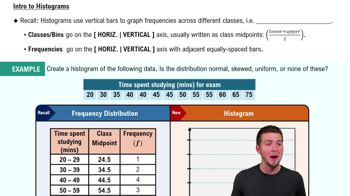
Histograms
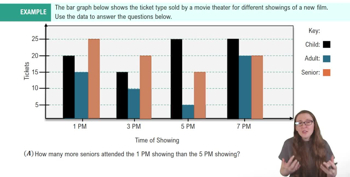
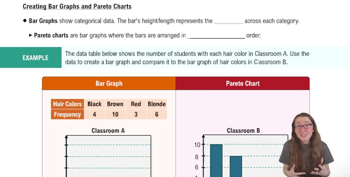
Bar Graphs and Pareto Charts
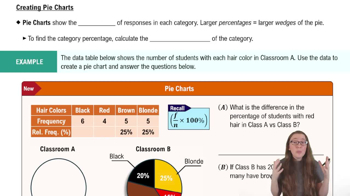
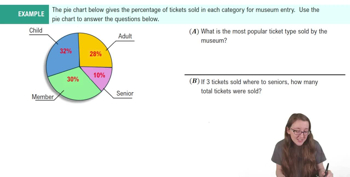
Pie Charts
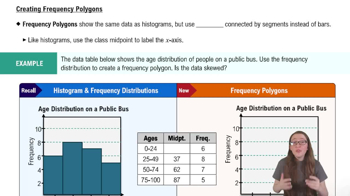
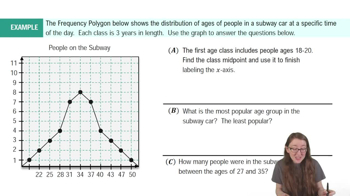
Frequency Polygons
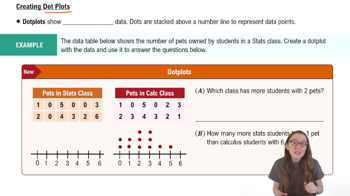
Dot Plots
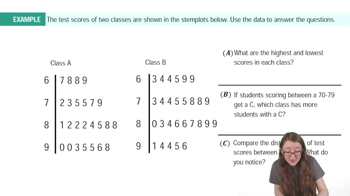
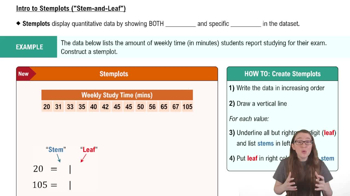
Stemplots (Stem-and-Leaf Plots)
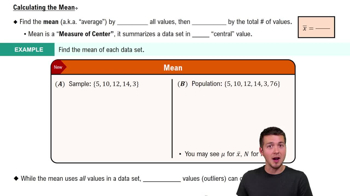
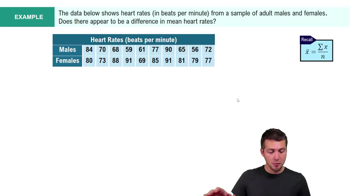
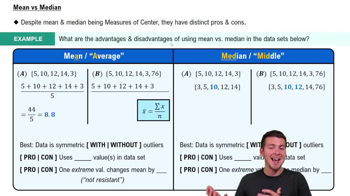
Mean
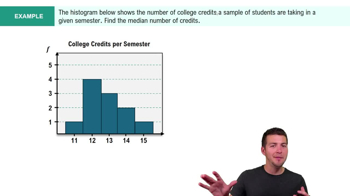
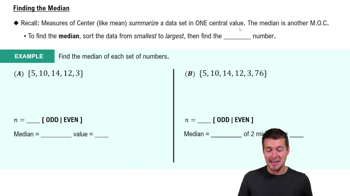
Median
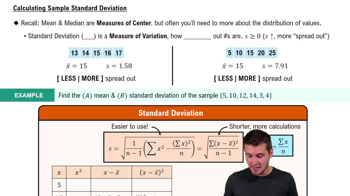
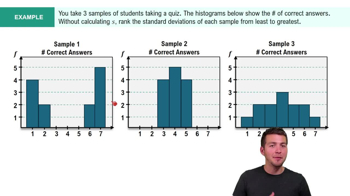
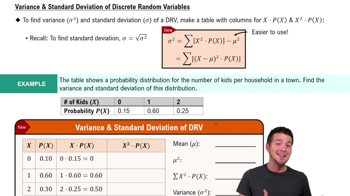
Standard Deviation
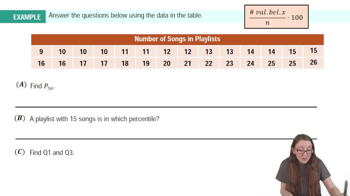
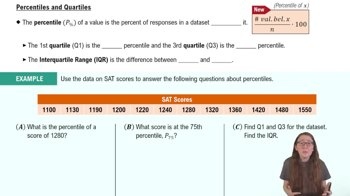
Percentiles & Quartiles
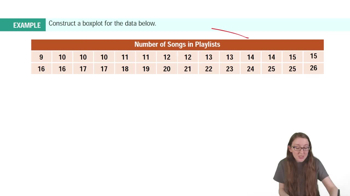
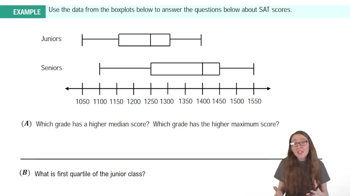
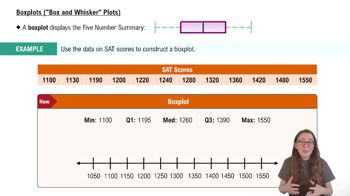
Boxplots
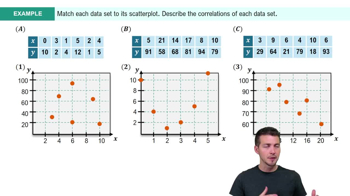
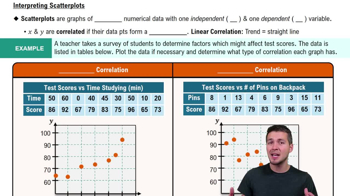
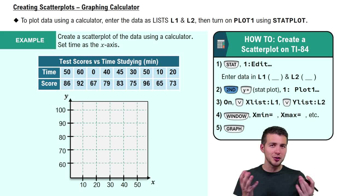
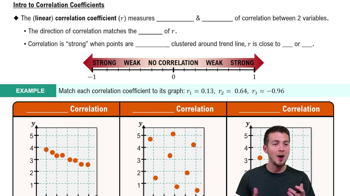
Scatterplots & Intro to Correlation
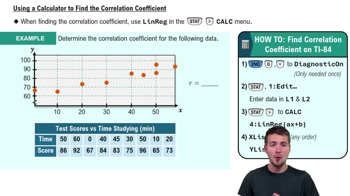
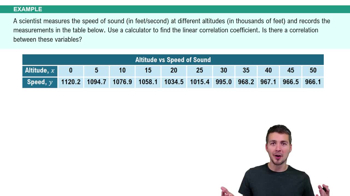
Correlation Coefficient
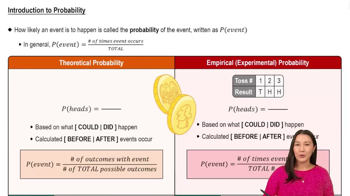
Basic Concepts of Probability
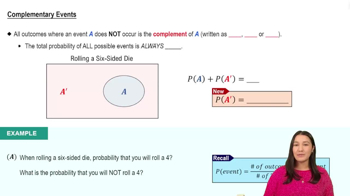
Complements
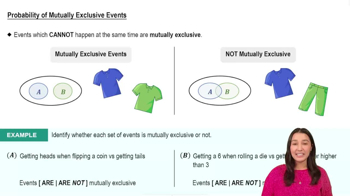
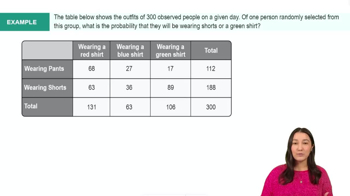
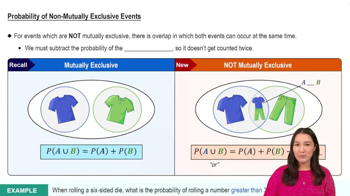
Addition Rule
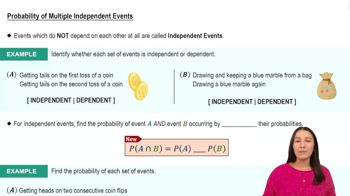
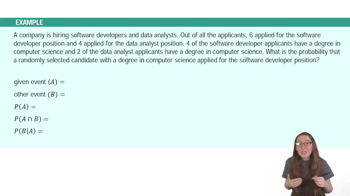
Multiplication Rule: Independent Events
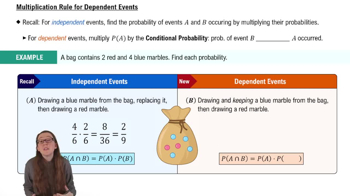
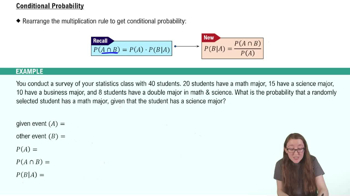
Multiplication Rule: Dependent Events
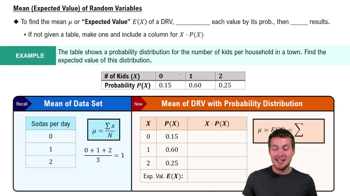
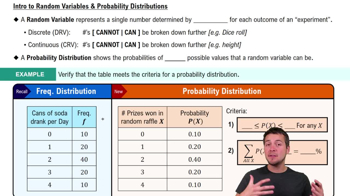
Discrete Random Variables
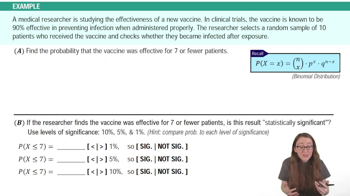
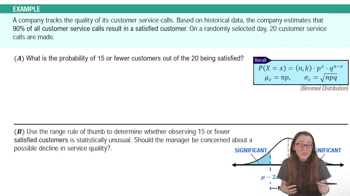
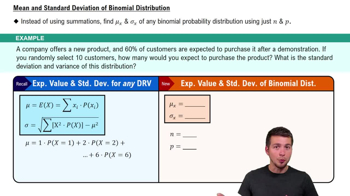
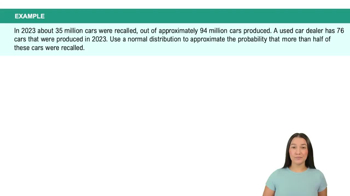
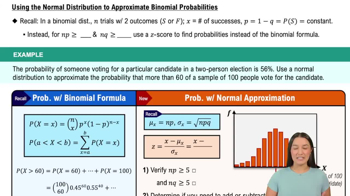
Binomial Distribution
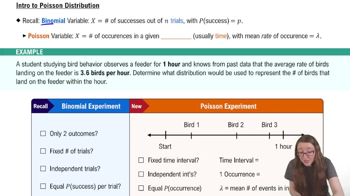
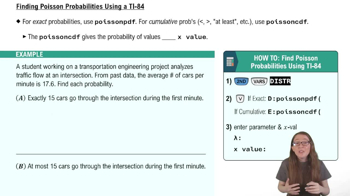
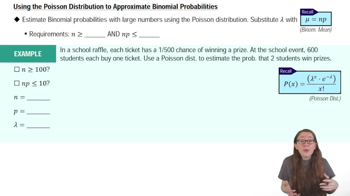
Poisson Distribution
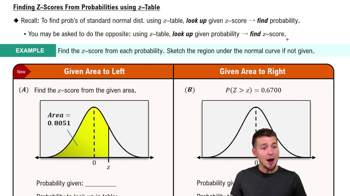
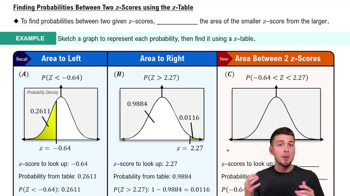
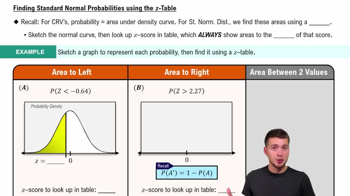
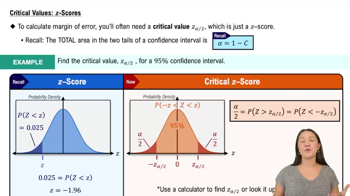
Standard Normal Distribution
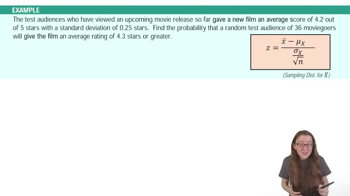
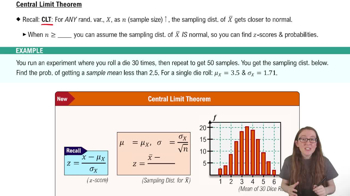
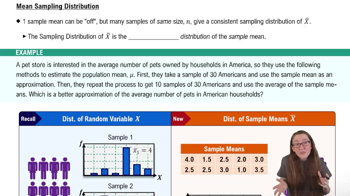
Sampling Distribution of the Sample Mean and Central Limit Theorem
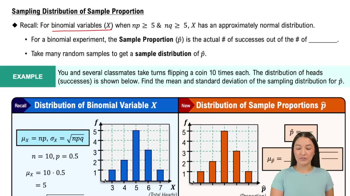
Sampling Distribution of Sample Proportion
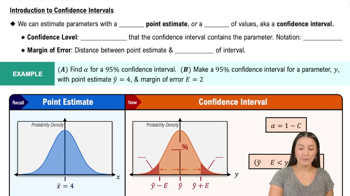
Introduction to Confidence Intervals
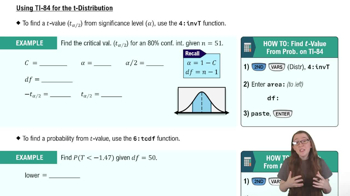
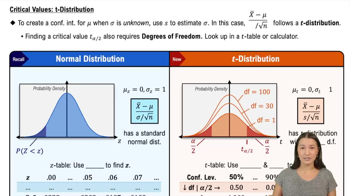
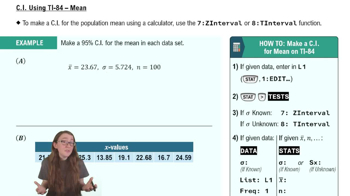
Confidence Intervals for Population Mean
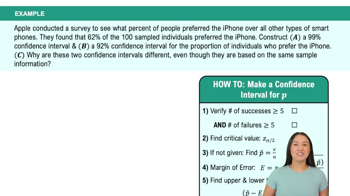
Confidence Intervals for Population Proportion
Steps in Hypothesis Testing
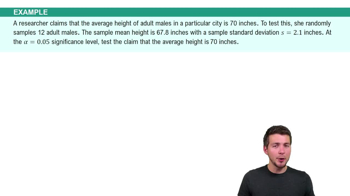
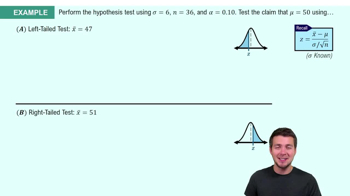
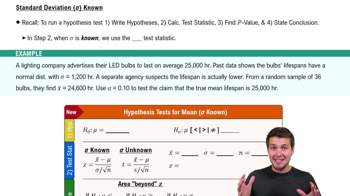
Performing Hypothesis Tests: Means
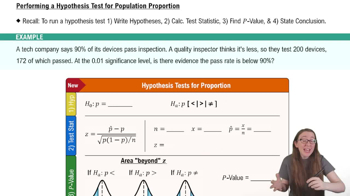
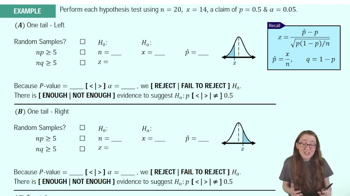
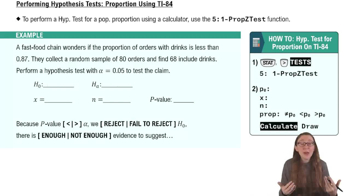
Performing Hypothesis Tests: Proportions
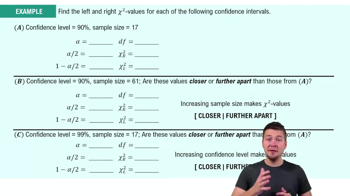
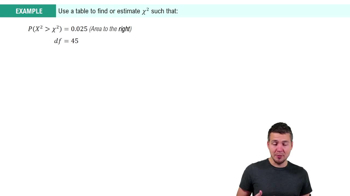
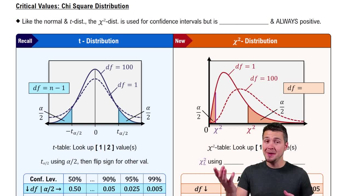
Chi Square Distribution
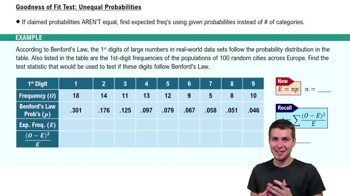
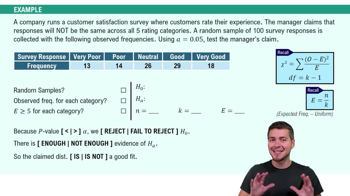
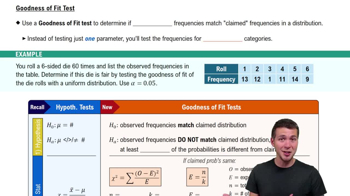
Goodness of Fit Test
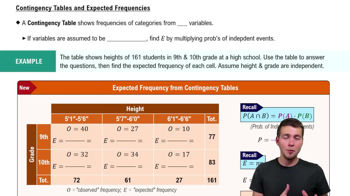
Contingency Tables
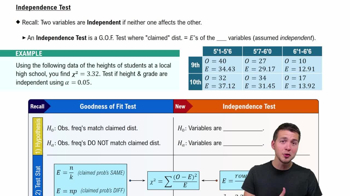
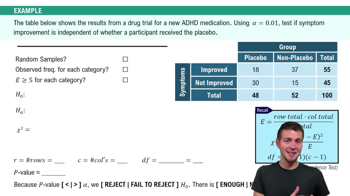
Independence Tests
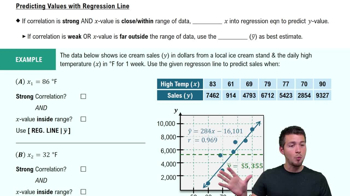
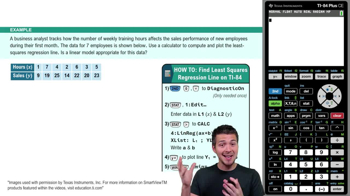
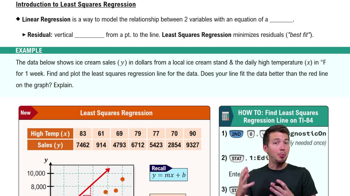
Linear Regression & Least Squares Method
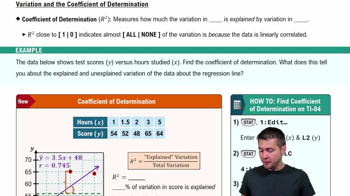
Coefficient of Determination
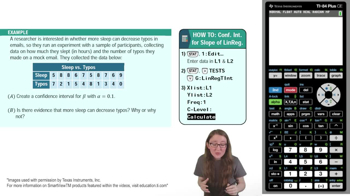
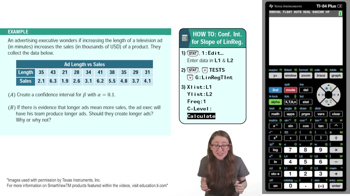
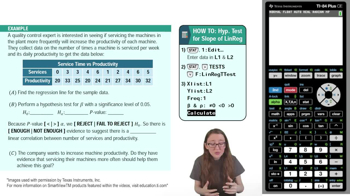
Inferences for Slope
 뒤로
 업로드한 자료에 맞춘 엄선된 수업 – 모든 주제를 단계별로 배워보세요.
 04:24