 뒤로
Introductory Statistics Midterm Review Study Guide
스터디 가이드 - 스마트 노트
 자료에 맞춘 맞춤형 노트, 핵심 정의, 예시, 맥락을 확장해 제공합니다.
Chapter 1: Introduction to Statistics and Collecting Data
Types of Variables
Variables are characteristics or attributes that can take on different values. Understanding the types of variables is fundamental in statistics.
Qualitative (Categorical) Variables: Classify individuals based on attributes or characteristics (e.g., gender, color).
Quantitative Variables: Provide numerical measures. Values can be meaningfully added or subtracted.
Discrete Variable: Has a finite or countable number of possible values (e.g., number of students).
Continuous Variable: Has an infinite number of possible values, measurable to any desired accuracy (e.g., height, time).
Parameter: Numerical summary of a population. Statistic: Numerical summary based on a sample.
Levels of Measurement
Nominal: Names, labels, or categorizes; no ranked order.
Ordinal: Properties of nominal, but values can be ranked.
Sampling Methods
Sampling is the process of selecting a subset of individuals from a population to estimate characteristics of the whole population.
Simple Random Sample: Each individual has an equal chance of being selected.
Stratified Sample: Population divided into strata; random sample from each stratum.
Systematic Sample: Select every k-th individual after a random start.
Cluster Sample: Population divided into groups; select entire groups randomly.
Convenience Sample: Individuals easily obtained; may not be representative.
Types of Studies
Observational Study: Researcher observes without intervention.
Case-Controlled Study: Sample divided into groups based on behavior.
Experimental Study: Researcher manipulates variables to observe effects.
Confounding Variables: Variables that affect each other, making it hard to distinguish their effects.
Treatment Group: Receives the treatment.
Control Group: Does not receive the treatment.
Chapter 2: Describing Data with Tables and Graphs
Relative Frequency and Distributions
Relative frequency is the proportion of observations within a category.
Relative Frequency Formula:
Relative Frequency Distribution: Lists each category with its relative frequency; proportions sum to 1.
Graphical Representations
Bar Graph: Categories on one axis, frequency/relative frequency on the other; rectangles represent frequencies.
Pareto Chart: Bar graph with bars in decreasing order of frequency.
Side-by-Side Graphs: Compare data using relative frequencies.
Pie Chart: Circle divided into sectors proportional to category frequency.
Histogram: Rectangles for each class; rectangles touch, representing frequency or relative frequency.
Chapter 3: Describing Data Numerically
Measures of Central Tendency
Central tendency describes the center of a data set.
Mean: Average value.
Median: Middle value when data is ordered.
Mode: Most frequently occurring value.
Skewness
Left Skewed: Mean < Median
Symmetric: Mean = Median
Right Skewed: Mean > Median
Measures of Spread
Range:
Variance: Measures average squared deviation from the mean.
Standard Deviation: Square root of variance; measures spread.
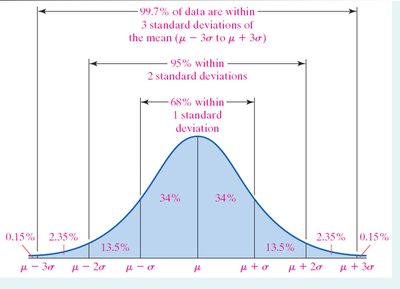
Empirical Rule
If the distribution is bell-shaped:
68% of data within 1 standard deviation of the mean
95% within 2 standard deviations
99.7% within 3 standard deviations
Z-Score
The z-score measures the distance of a data value from the mean in units of standard deviation.
Z-Score Formula:
Z-score is unitless; mean = 0, standard deviation = 1.
Extreme outlier: z < -3.0 or z > 3.0
Percentiles and Quartiles
Percentile Formula: , where i is the term number for the k-th percentile.
Quartiles:
Q1:
Q2:
Q3:
Interquartile Range (IQR):
Lower Fence:
Upper Fence:
Five-Number Summary
Minimum
First Quartile (Q1)
Median (Q2)
Third Quartile (Q3)
Maximum
Chapter 5: Probability
Probability Concepts
Probability quantifies the likelihood of an event occurring.
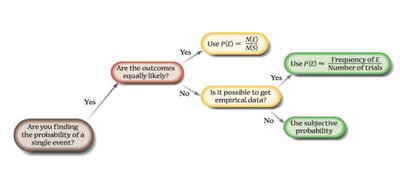
Theoretical Probability: All outcomes equally likely.
Empirical Probability: Based on observed data.
Disjoint (Mutually Exclusive) Events
Events with no outcomes in common.
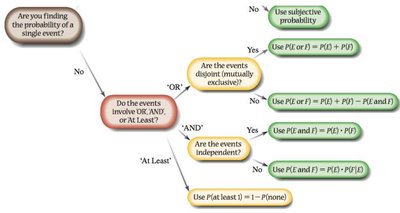
Addition Rule for Disjoint Events:
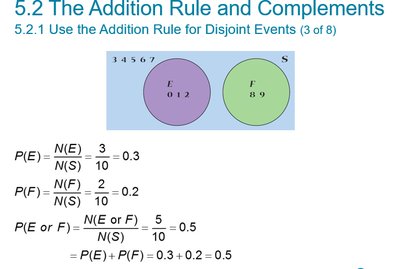
General Addition Rule
For any two events:
Complement Rule
The complement of event E is all outcomes not in E.
Independent and Dependent Events
Independent: Occurrence of one event does not affect the other.
Dependent: Occurrence of one event affects the probability of the other.
Multiplication Rule for Independent Events:
Multiplication Rule for n Independent Events:
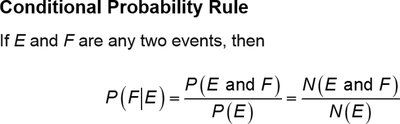
Conditional Probability
Conditional probability is the probability of event F given that event E has occurred.
Conditional Probability Formula:
Multiplication Rule of Counting
If a task consists of a sequence of choices, multiply the number of options for each step.
Example: If there are 3 choices for the first step and 2 for the second, total ways = 3 × 2 = 6.
Permutations and Combinations
Permutation: Ordered arrangement; no repetition.
Combination: Unordered selection; no repetition.
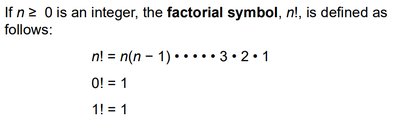
Factorial: ; ,
Probability Rules Flowcharts
Chapter 6: Binomial Distribution & Discrete Random Variables
Random Variables
A random variable represents possible numerical values from a random event.
Discrete Random Variable: Can assume only a countable number of values (e.g., number of complaints per day).
Continuous Random Variable: Can assume any value on a continuum (e.g., time, height).
Discrete Probability Distribution
List of all possible pairs [xi, P(xi)]
xi: Value of random variable
P(xi): Probability associated with xi
xi’s are mutually exclusive and collectively exhaustive
0 ≤ P(xi) ≤ 1 for each xi
Sum of all probabilities = 1
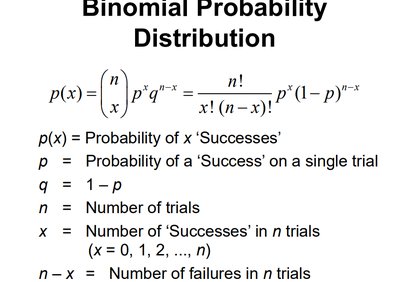
Binomial Distribution
The binomial distribution models the number of successes in a fixed number of independent trials, each with the same probability of success.
n: Number of trials
p: Probability of success
q: Probability of failure (q = 1 - p)
x: Number of successes in n trials
Trials are independent
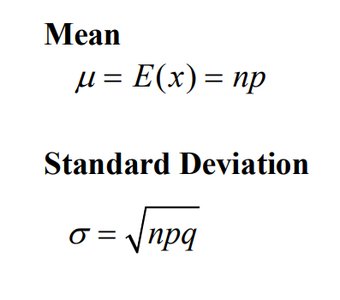
Mean and Standard Deviation of Binomial Distribution
Mean:
Standard Deviation:
Chapter 7: Continuous Probability Distributions
Uniform Distribution
A uniform distribution is a type of continuous probability distribution where all outcomes are equally likely within a certain interval.
Probability is constant across the interval.
Used to model situations where each outcome in a range is equally likely.
