 뒤로
Introductory Statistics Study Guide: Key Concepts and Data Analysis
스터디 가이드 - 스마트 노트
 자료에 맞춘 맞춤형 노트, 핵심 정의, 예시, 맥락을 확장해 제공합니다.
Descriptive vs. Inferential Statistics
Definitions and Applications
Descriptive statistics summarize and describe the features of a dataset, while inferential statistics use sample data to make generalizations about a population.
Descriptive statistics: Include measures such as averages, percentages, tables, graphs, and ranges. They describe the data you have collected.
Inferential statistics: Allow you to infer or predict characteristics of a larger population based on a sample.
Example: Surveying 100 students and calculating their average study hours is descriptive; using that average to estimate the study hours for all students is inferential.
Samples, Populations, Statistics, and Parameters
Key Terms and Relationships
Understanding the distinction between samples and populations is fundamental in statistics.
Population: The entire group you want to study.
Sample: A subset of the population selected for analysis.
Parameter: A numerical value that describes a characteristic of the population.
Statistic: A numerical value that describes a characteristic of the sample.
Example: The average age of all students (parameter) vs. the average age of a sample of 100 students (statistic).
Representative Samples
Importance in Statistical Inference
A representative sample accurately reflects the characteristics of the population, ensuring valid inferences.
Key Point: Sampling bias can lead to incorrect conclusions about the population.
Sampling Procedures
Types of Sampling Methods
Different sampling methods are used to select samples from populations.
Random Sampling: Every member has an equal chance of being selected.
Stratified Sampling: Population divided into groups (strata), and samples are taken from each group.
Cluster Sampling: Population divided into clusters, and entire clusters are randomly selected.
Convenience Sampling: Samples are taken from individuals who are easiest to reach.
Example Table:
Sampling Type | Description | Example |
|---|---|---|
Random | Equal chance for all | Randomly select 50 students |
Stratified | Some from every group | Pick 25 from each class year |
Cluster | All from some groups | Survey all students in 2 class years |
Convenience | Easy to reach | Survey first 50 in cafeteria |
Observational vs. Experimental Research
Research Designs and Causality
Observational: Researchers observe without intervention; cannot establish causality.
Experimental: Researchers manipulate variables; can provide evidence for cause and effect.
Example: Observing exercise habits vs. assigning exercise routines.
Quantitative Variables: Discrete vs. Continuous
Classification of Variables
Discrete: Countable values (e.g., number of children).
Continuous: Measurable values within a range (e.g., height, weight).
Example: Number of siblings is discrete; height is continuous.
Scales of Measurement
Types of Measurement Scales
Nominal: Categories without order (e.g., eye color).
Ordinal: Ordered categories (e.g., satisfaction level).
Interval: Ordered, meaningful differences, no true zero (e.g., temperature).
Ratio: Ordered, meaningful differences, true zero (e.g., weight).
Scale | Description | Example |
|---|---|---|
Nominal | Names only | Eye color |
Ordinal | Order/rank | Satisfaction level |
Interval | Equal intervals, no true zero | Temperature (°F) |
Ratio | True zero | Weight |
Random Error vs. Systematic Error
Types of Measurement Error
Random Error: Unpredictable variation; can be reduced by averaging.
Systematic Error: Consistent bias; must be corrected at the source.
Example: Fluctuating scale readings (random) vs. consistently miscalibrated scale (systematic).
Visual Displays of Data
Interpreting Common Graphs
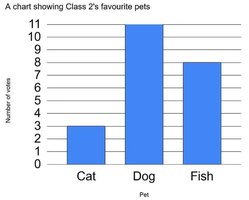
Bar Graph: Compares categories; tallest bar shows highest frequency.
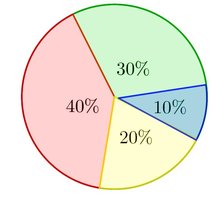
Pie Chart: Shows parts of a whole; largest slice represents largest percentage.
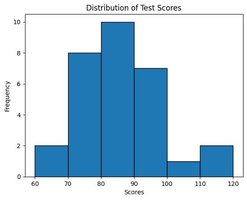
Histogram: Shows distribution of numerical data; bars touch, representing intervals.
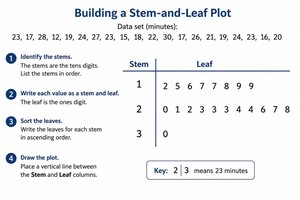
Stem-and-Leaf Plot: Displays numerical data by place value; keeps original values visible.
Measures of Central Tendency: Mean, Median, Mode
Calculating and Interpreting
Mean: Average; sum of values divided by number of values.
Median: Middle value when data are ordered.
Mode: Most frequently occurring value.
Example: For 4, 6, 6, 8, 11: Mean = 7, Median = 6, Mode = 6.
Effect of Outliers
Impact on Mean, Median, and Mode
Mean: Strongly affected by outliers.
Median: Resistant to outliers.
Mode: Usually unaffected unless the outlier is frequent.
Example: Adding 100 to 10, 11, 12, 13, 14 shifts the mean but not the median or mode.
Boxplots (Box-and-Whisker Plots)
Interpreting Boxplots
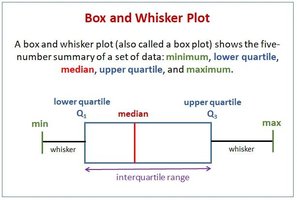
Boxplots display the five-number summary: minimum, first quartile (Q1), median, third quartile (Q3), and maximum.
Minimum: Smallest value
Q1: 25% below this value
Median: Middle value
Q3: 75% below this value
Maximum: Largest value
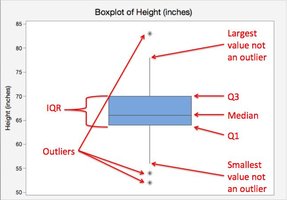
Interquartile Range (IQR):
Outliers: Values outside the whiskers may be marked as outliers.
Variance and Standard Deviation
Measuring Spread
Variance and standard deviation quantify how much data values deviate from the mean.
Variance: Average of squared differences from the mean.
Standard Deviation: Square root of variance.
Population vs. Sample: Population variance divides by N; sample variance divides by n-1.
Example: For 2, 4, 6: Mean = 4, Variance = 2.67, Standard deviation ≈ 1.63.
Percentiles and Z-Scores
Calculating Percentiles
To determine the percentile of a score, calculate its z-score and use the normal distribution.
Z-score formula:
Percentile: Use z-score to find the percentage of scores below the given value.
Example: Score = 85, Mean = 75, SD = 10: , percentile ≈ 84th.
Central Limit Theorem
Sampling Distributions
The Central Limit Theorem states that the distribution of sample means approaches normality as sample size increases, regardless of population distribution.
Mean of sampling distribution:
Standard error:
Example: Population mean = 100, SD = 20, n = 25: Standard error = 4.
Additional info: All explanations are expanded for clarity and completeness, suitable for exam preparation in an introductory statistics course.
