 뒤로
Mini-Textbook Study Guide: Sampling Distributions, Estimation, and Hypothesis Testing in Introductory Statistics
스터디 가이드 - 스마트 노트
 자료에 맞춘 맞춤형 노트, 핵심 정의, 예시, 맥락을 확장해 제공합니다.
Sampling Distributions
Sampling Distribution of Sample Means
The sampling distribution of sample means is a fundamental concept in inferential statistics. It describes the distribution of means calculated from multiple random samples drawn from the same population.
Shape: If the population is normal, the sampling distribution of the sample mean is also normal. If the population is not normal, the sampling distribution approaches normality as sample size increases (Central Limit Theorem).
Mean: The mean of the sampling distribution equals the population mean, denoted as .
Standard Deviation: The standard deviation of the sampling distribution (standard error) is , where is the population standard deviation and is the sample size.
Example: The upper leg length of 20-29 year old males is approximately normal with mean 43.7 cm and standard deviation 4.2 cm. For a sample of 12 males:
Shape: Normal
Mean: 43.7 cm
Standard Error: cm
Application: To calculate the probability that a sample mean is less than a certain value, use the z-score formula:
Example: Probability that the average upper leg length of 12 males is less than 40 cm:
Use the standard normal table to find the probability.
Sampling Distribution of Proportions
The sampling distribution of sample proportions describes the distribution of proportions calculated from random samples.
Shape: Approximately normal if and .
Mean: (population proportion)
Standard Error:
Example: In a sample of 120 Americans, 15% have hearing trouble:
Shape: Normal (since and )
Mean: 0.15
Standard Error:
Estimation: Confidence Intervals
Estimating Population Mean (t-distribution)
When the population standard deviation is unknown and the sample size is small, the t-distribution is used to construct confidence intervals for the mean.
Point Estimate: Sample mean
Critical Value: from the t-distribution table, based on confidence level and degrees of freedom ()
Standard Error:
Margin of Error:
Confidence Interval:
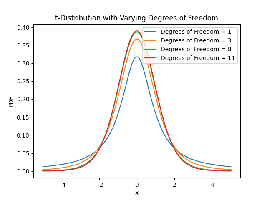
Properties of the t-distribution:
Different for each sample size (degrees of freedom)
Centered at 0
Symmetric
Total area under the curve is 1
Example: A sample of 92 was taken to determine the mean number of licks to the center of a tootsie pop (, ):
Point Estimate: 356.1
Standard Error:
Margin of Error: (use appropriate for confidence level)
Confidence Interval:
Estimating Population Proportion
Confidence intervals for proportions are constructed using the normal (z) distribution.
Point Estimate: Sample proportion
Critical Value: from the standard normal table
Standard Error:
Margin of Error:
Confidence Interval:
Common z* values: 1.645 (90%), 1.96 (95%), 2.576 (99%)
Hypothesis Testing
Hypothesis Testing for Means
Hypothesis testing is used to determine if there is evidence to support a claim about a population mean.
Null Hypothesis (H0): Assumed to be true claim (e.g., )
Alternative Hypothesis (Ha): Data-supported claim (e.g., , , )
Significance Level (α): Probability threshold for rejecting H0 (common values: 0.01, 0.05, 0.10)
Test Statistic:
P-value: Probability of observing the sample result, or more extreme, if H0 is true
Decision: If p-value < α, reject H0; otherwise, fail to reject H0
Types of Errors
Type I Error: Rejecting a true null hypothesis (false positive)
Type II Error: Failing to reject a false null hypothesis (false negative)
Two-Sample Tests and Confidence Intervals
Two-Sample t-Test for Means
Used to compare the means of two independent populations.
Null Hypothesis:
Alternative Hypothesis: (or , )
Test Statistic:
Confidence Interval for Difference:
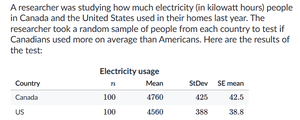
Example Table: Comparison of electricity usage between Canada and US:
Country | n | Mean | StDev | SE mean |
|---|---|---|---|---|
Canada | 100 | 4760 | 425 | 42.5 |
US | 100 | 4560 | 388 | 38.8 |
Two-Sample Z-Test for Proportions
Used to compare proportions between two independent groups.
Null Hypothesis:
Alternative Hypothesis: (or , )
Test Statistic: where is the pooled proportion.
Confidence Interval for Difference:
Summary Table: Key Formulas
Concept | Formula | Notes |
|---|---|---|
Standard Error (mean) | Population standard deviation | |
Standard Error (proportion) | Population proportion | |
Confidence Interval (mean) | Sample standard deviation | |
Confidence Interval (proportion) | Sample proportion | |
Test Statistic (mean) | Sample mean vs. hypothesized mean | |
Test Statistic (proportion) | Sample proportion vs. hypothesized proportion |
Vocabulary
Point Estimate: A single value estimate of a population parameter.
Critical Value: The value that marks the boundary for rejection of the null hypothesis.
Standard Error: The standard deviation of a sampling distribution.
Margin of Error: The range within which the true parameter is expected to lie.
Confidence Interval: An interval estimate for a population parameter.
P-value: The probability of obtaining a result at least as extreme as the observed result, assuming the null hypothesis is true.
Statistically Significant: When the p-value is less than the significance level, indicating evidence against the null hypothesis.
