 뒤로
Numerical Summaries of Data: Measures of Center, Dispersion, and Position
스터디 가이드 - 스마트 노트
 자료에 맞춘 맞춤형 노트, 핵심 정의, 예시, 맥락을 확장해 제공합니다.
Numerical Summaries of Data
Descriptive Statistics with Technology
Descriptive statistics summarize and describe the main features of a dataset. Calculators and statistical software can quickly compute these summaries, which include measures of center, dispersion, and position.
TI-84 Calculator: Use the '1-Var Stats' function to compute most descriptive statistics except variance and interquartile range (IQR).
Minitab: Use the 'Display Descriptive Statistics' option under 'Basic Statistics' to compute a variety of statistics for selected variables.
Measures of Center
Mean
The mean is the arithmetic average of a dataset, calculated as the sum of all observations divided by the number of observations. It is a common measure of the center of quantitative data.
Population mean (\(\mu\)):
Sample mean (\(\bar{x}\)):
The mean is sensitive to extreme values (outliers).
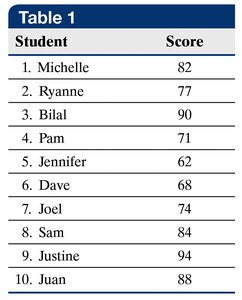
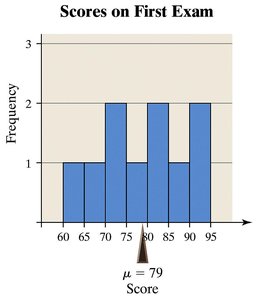
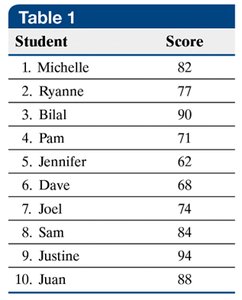
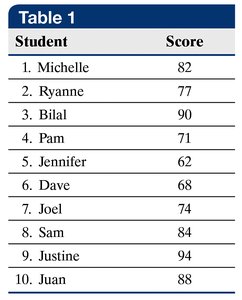
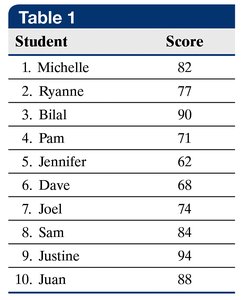
Example: The following table shows the scores of 10 students. The population mean is \(\mu = 79\).
Mean as a Measure of Center
The mean can be interpreted as the dataset's center of gravity. In a histogram, the mean is the balance point.
Median
The median is the value that lies in the middle of the dataset when the observations are arranged in ascending order. It divides the data into two equal halves.
Denoted as \(M\).
Resistant to outliers.
Example: For the same dataset, the median is \(M = 79.5\).
Comparing Mean and Median
When a dataset contains outliers or is skewed, the mean and median can differ significantly. The median is a better measure of center for skewed data or data with outliers.
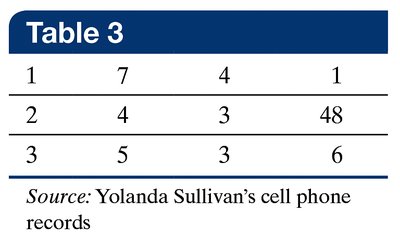
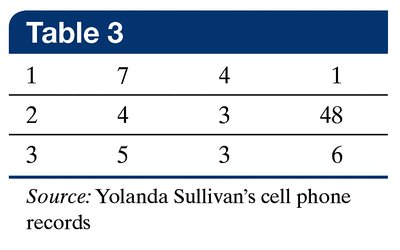
Example: Yolanda's phone call lengths have a mean of 7.25 and a median of 3.5. The mean is influenced by one long call (48 minutes), making the median a better descriptor of a typical call.
Mode
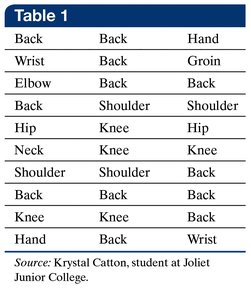
The mode is the most frequently occurring value in a dataset. A dataset can have one mode, more than one mode, or no mode at all. The mode is useful for both quantitative and qualitative data.
Example: In the following table, the mode is "Back" because it appears most frequently.
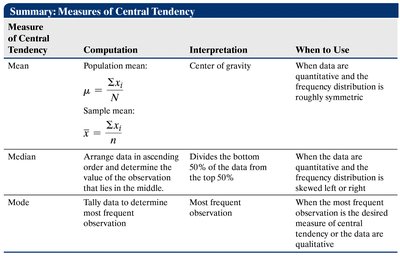
Summary Table: Measures of Central Tendency
Measure of Central Tendency | Computation | Interpretation | When to Use |
|---|---|---|---|
Mean | Population: Sample: | Center of gravity | Quantitative data, roughly symmetric distribution |
Median | Middle value in ordered data | Divides bottom 50% from top 50% | Quantitative data, skewed or with outliers |
Mode | Most frequent observation | Most frequent observation | Qualitative data or when mode best describes center |
Measures of Dispersion
Dispersion
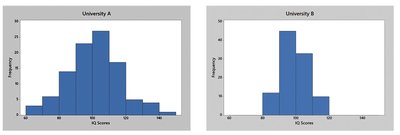
Dispersion refers to how spread out the values are from the center. Common measures include range, variance, standard deviation, and interquartile range (IQR).
Range
The range is the difference between the maximum and minimum values in a dataset.
Formula:
Example: For the student scores, .
Standard Deviation and Variance
The standard deviation (SD) measures the average distance of data points from the mean. The variance is the square of the standard deviation.
Population SD (\(\sigma\)):
Sample SD (\(s\)):
Population variance:
Sample variance:
Example: For the sample of Ryanne, Jennifer, Dave, and Juan, and .
Interquartile Range (IQR)
The interquartile range (IQR) measures the spread of the middle 50% of the data and is resistant to outliers.
Formula:
Q1: First quartile (25th percentile)
Q3: Third quartile (75th percentile)
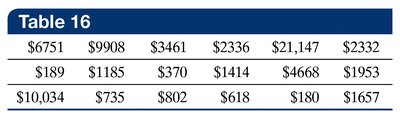
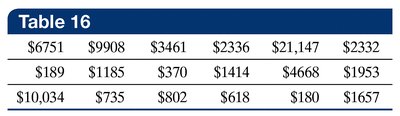
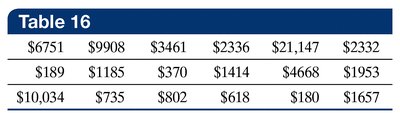
Example: For the collision coverage claims data, , , so .

Summary Table: Measures of Dispersion
Range: Measures total variation.
Standard deviation: Measures average variation from the mean.
Variance: Square of the standard deviation.
IQR: Measures variation of the middle half; resistant to outliers.
Measures of dispersion cannot be negative.
Measures of Position
z-Score
The z-score indicates how many standard deviations a value is from the mean. It is used to compare values from different datasets or to identify unusual values.
Formula:
z-scores farther from 0 indicate more unusual values.
z-scores ≥ 2 or ≤ -2 are generally considered abnormal.
Example: A score of 73 on two exams with different means and standard deviations yields different z-scores, indicating relative performance.
Empirical Rule
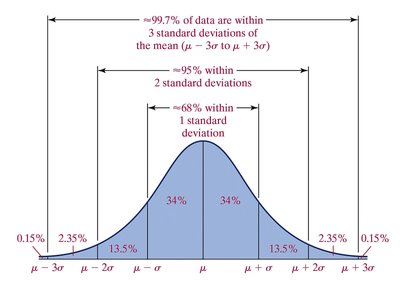
The Empirical Rule applies to bell-shaped (normal) distributions:
About 68% of data within 1 SD of the mean
About 95% within 2 SDs
About 99.7% within 3 SDs
Chebyshev’s Inequality
Chebyshev’s Inequality applies to any dataset, regardless of shape. At least of the data lies within standard deviations of the mean, for .
For , at least 75% of data is within 2 SDs of the mean.
Percentiles and Quartiles
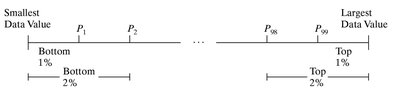
Percentiles indicate the relative standing of a value within a dataset. The th percentile () is the value below which $k$ percent of the data falls.
Median is the 50th percentile ().
First quartile () is the 25th percentile ().
Third quartile () is the 75th percentile ().

Identifying Outliers
Upper and Lower Fences
Outliers can be identified using the IQR and quartiles:
Lower fence:
Upper fence:
Values outside these fences are considered outliers.
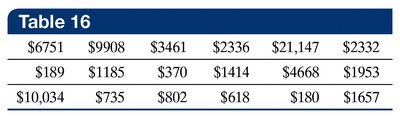
Example: For the collision claims data, the only outlier is $21,147, which exceeds the upper fence.
Five-Number Summary and Boxplot
Five-Number Summary
The five-number summary consists of the minimum, first quartile (), median, third quartile (), and maximum. It provides a concise summary of the distribution of a dataset.
Can be visualized using a boxplot.
Boxplots display the spread and identify outliers.
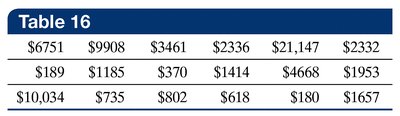
Example: For the collision claims data, the five-number summary is:
Minimum: $189
Q1: $735
Median: $1,805
Q3: $4,668
Maximum: $21,147
Boxplots in Software
Minitab: Can create simple and side-by-side boxplots for visual comparison of distributions.
