 뒤로
Numerically Summarizing Data: Measures of Central Tendency, Dispersion, Position, and Boxplots
스터디 가이드 - 스마트 노트
 자료에 맞춘 맞춤형 노트, 핵심 정의, 예시, 맥락을 확장해 제공합니다.
Numerically Summarizing Data
Measures of Central Tendency
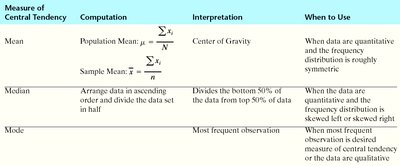
Measures of central tendency describe the center of a data set and are fundamental for understanding distributions. The three main measures are the mean, median, and mode.
Mean: The arithmetic mean is the sum of all values divided by the number of observations. For a population, it is denoted by , and for a sample, by . Formula: Population mean: Sample mean: Interpretation: The mean represents the 'center of gravity' of the data. When to Use: When data are quantitative and the distribution is roughly symmetric.
Median: The median is the middle value when data are ordered. If the number of observations is odd, it is the value at position . If even, it is the average of the two middle values. Interpretation: Divides the bottom 50% from the top 50% of data. When to Use: When the distribution is skewed left or right.
Mode: The mode is the value that occurs most frequently. Interpretation: Most frequent observation. When to Use: When the most frequent observation is desired or for qualitative data.
Example: Music Video Counts
Consider the following data for music video counts:
Performer | Music Videos |
|---|---|
Michael Jackson | 31 |
Taylor Swift | 26 |
Usher | 26 |
Katy Perry | 15 |
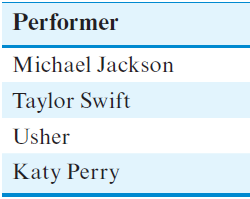
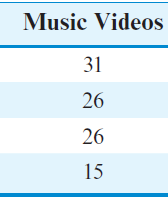
Mean: Median: Arrange values: 15, 26, 26, 31. Median = (26 + 26)/2 = 26. Mode: 26 (appears twice).
Relation Between Mean, Median, and Distribution Shape
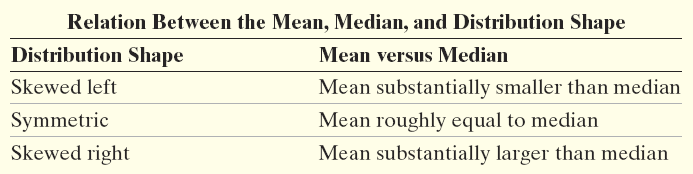
The relationship between the mean and median helps identify the shape of the distribution:
Distribution Shape | Mean versus Median |
|---|---|
Skewed left | Mean substantially smaller than median |
Symmetric | Mean roughly equal to median |
Skewed right | Mean substantially larger than median |
Measures of Dispersion
Measures of dispersion quantify the spread or variability of a data set. The main measures are range, variance, and standard deviation.
Range
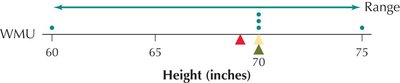
The range is the difference between the largest and smallest values in the data set.
Formula: Range = Largest value – Smallest value
Limitation: Sensitive to extreme values; ignores all values except extremes.

Standard Deviation and Variance
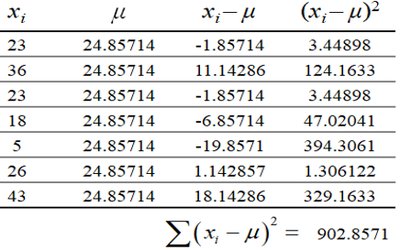
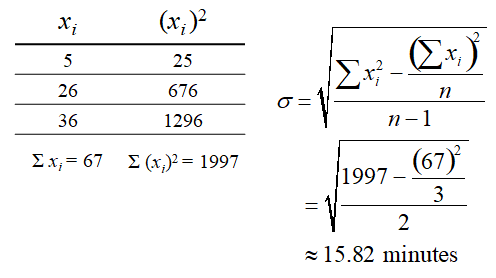
The standard deviation measures the average distance of data values from the mean. Variance is the square of the standard deviation.
Sample Standard Deviation:
Population Standard Deviation:
Sample Variance:
Population Variance:
Using Technology for Dispersion Measures
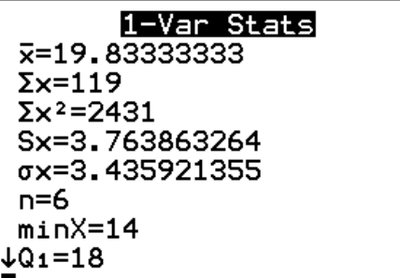
Statistical calculators can quickly compute mean, variance, and standard deviation for a data set.
Empirical Rule and Chebyshev's Rule
Empirical Rule
For bell-shaped (normal) distributions:
About 68% of data falls within 1 standard deviation of the mean
About 95% within 2 standard deviations
About 99.7% within 3 standard deviations
Chebyshev's Rule
For any distribution, at least of data falls within standard deviations of the mean, where .
For : At least 75% of data within 2 standard deviations
For : At least 88.89% within 3 standard deviations
Measures of Position and Outliers
z-Scores
A z-score indicates how many standard deviations a value is from the mean.
Sample z-score:
Population z-score:
Positive z-score: Value above mean; Negative: Below mean; Zero: Equal to mean.
Percentiles and Percentile Ranks
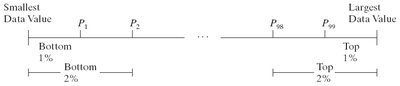
Percentiles indicate the relative position of a value in a data set.
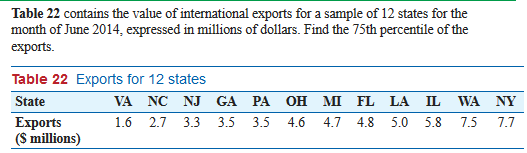
The kth percentile, , is the value below which k% of data falls.
Percentile rank of : Percentage of values less than or equal to $x$.
To find the kth percentile: If is an integer, is the value at position $i$; otherwise, average the values at positions closest to $i$.
Quartiles
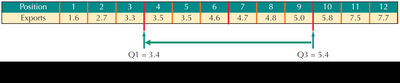
Quartiles divide the data into four equal parts:
Q1: 25th percentile
Q2: 50th percentile (median)
Q3: 75th percentile
Interquartile Range (IQR)
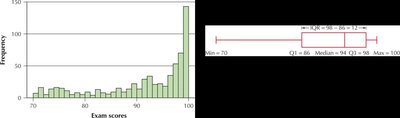
The IQR is a robust measure of spread, calculated as . It represents the spread of the middle 50% of the data.
Five-Number Summary and Boxplots
Five-Number Summary
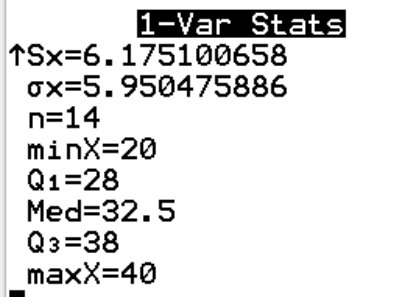
The five-number summary consists of:
Minimum
Q1
Median (Q2)
Q3
Maximum
Boxplots
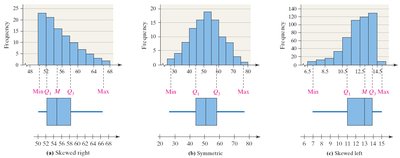
Boxplots graphically display the five-number summary and help visualize the distribution's shape and identify outliers.
Box extends from Q1 to Q3, with a line at the median
Whiskers extend to minimum and maximum values (excluding outliers)
Outliers are marked separately
Distribution Shape and Boxplots
Boxplots can illustrate skewness:
Skewed right: Longer whisker on the right, mean > median
Symmetric: Whiskers and box are balanced, mean ≈ median
Skewed left: Longer whisker on the left, mean < median
Detecting Outliers with IQR
A value is an outlier if it is:
Below Q1 - 1.5(IQR)
Above Q3 + 1.5(IQR)
Boxplots and quartiles are useful for describing the shape and identifying outliers in a distribution.
