 뒤로
Probability Basics and Rules: Study Notes for Introductory Statistics
스터디 가이드 - 스마트 노트
 자료에 맞춘 맞춤형 노트, 핵심 정의, 예시, 맥락을 확장해 제공합니다.
Probability Basics
Definition and Importance
Probability is a fundamental concept in statistics, used to quantify uncertainty in outcomes. It allows us to estimate the likelihood of events and make informed decisions based on data.
Probability Model: A mathematical description of random phenomena, specifying possible outcomes and their likelihoods.
Experiment: An action or process whose outcome cannot be predicted with certainty.
Event: A specific result or set of results from an experiment.
Equal-Likelihood Model
When all outcomes of an experiment are equally likely, the probability of an event is calculated as:
Formula: , where f is the number of ways the event can occur, and N is the total number of possible outcomes.
Example: Choosing 3 people from a group of 5. The number of possible teams is .
Combinatorics in Probability
Combinatorics helps determine the number of ways events can occur, especially when order does not matter and there is no replacement.
Combination Formula:
Application: Used to count groups or teams formed from a larger set.
Basic Properties of Probabilities
Range: The probability of any event is between 0 and 1, inclusive: .
Impossible Event: Probability is 0.
Certain Event: Probability is 1.
Events and Sample Space
Sample Space and Events
The sample space is the set of all possible outcomes of an experiment. An event is any subset of the sample space.
Sample Space (S): Collection of all outcomes.
Event: Any subset of S.
Graphical Representation of Events
Venn diagrams are commonly used to visually represent events and their relationships within the sample space.
Sample Space: Shown as a rectangle.
Events: Shown as circles within the rectangle.
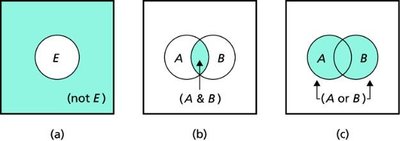
Relationships Among Events
Complement (not E): The event that E does not occur.
Intersection (A & B): Both A and B occur (overlap in Venn diagram).
Union (A or B): Either A or B or both occur (combined area in Venn diagram).
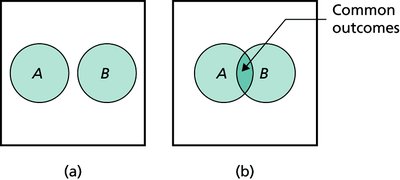
Mutually Exclusive Events
Events are mutually exclusive if they have no outcomes in common (no overlap in Venn diagram).
Example: Rolling a die: 'even' and 'odd' outcomes are mutually exclusive.
Non-mutually exclusive: Events that share outcomes (overlap in Venn diagram).
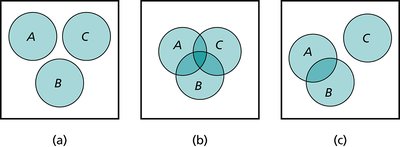
Rules of Probability
Complementation Rule
The probability that event E does not occur is:
Formula:
Addition Rules
There are two main addition rules for calculating the probability of unions of events:
Special Addition Rule (SAR): If A and B are mutually exclusive,
General Addition Rule (GAR): For any two events,
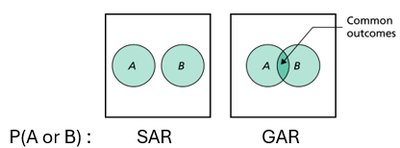
Note: If events are not mutually exclusive, subtract the probability of their intersection to avoid double-counting.
Examples and Applications
Example: If 85.8% of students attend public schools, 22.3% attend college, and 17.1% attend public colleges, then
Example: If , , and , then
Contingency Tables
Contingency tables are used to organize data and calculate probabilities for events involving two or more categories.
Example: Out of 100 students, 35 took History, 55 took Math, and 20 took both. Probabilities can be calculated for various combinations using the addition rules.
Summary Table: (Described in text)
P(History or Math):
P(Neither History nor Math):
P(Math but not History):
Additional info: Academic context and examples were expanded for clarity and completeness. All images included are directly relevant to the explanation of probability rules and event relationships.
