 뒤로
Regression Analysis: Exploring Associations Between Variables
스터디 가이드 - 스마트 노트
 자료에 맞춘 맞춤형 노트, 핵심 정의, 예시, 맥락을 확장해 제공합니다.
Regression Analysis: Exploring Associations Between Variables
Visualizing Variability with a Scatterplot
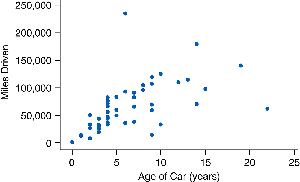
Scatterplots are a fundamental tool in statistics for examining relationships between two numerical variables. Each point on a scatterplot represents an observation, typically plotted using technology such as statistical software or graphing calculators. The scatterplot allows us to visually assess the association between variables, such as age and miles driven for used cars.
Definition: A scatterplot is a graph in which each point represents a pair of values for two numerical variables.
Purpose: To investigate associations and patterns between variables.
Example: Each point may represent (age of car, miles driven).
Examining Features of Scatterplots
When analyzing scatterplots, statisticians focus on three main features: trend, strength, and shape. These features help describe the nature of the association between the variables.
Trend: The general direction of the data as you move from left to right.
Strength: The degree to which the data points cluster around a trend.
Shape: The form of the association, such as linear or non-linear.
Trend
The trend describes the overall direction of the association between two variables:
Positive Association: As one variable increases, the other tends to increase. The scatterplot moves uphill from left to right.
Negative Association: As one variable increases, the other tends to decrease. The scatterplot moves downhill from left to right.
No Trend: No clear pattern; the variables do not appear to be related.
Neither Positive nor Negative: The association exists but cannot be characterized as strictly positive or negative.
Example: Positive Trend
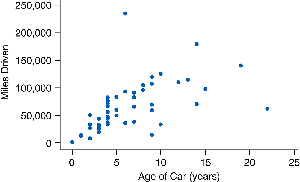
This scatterplot shows a positive trend: as the age of the car increases, the mileage also tends to increase.
Example: Negative Trend
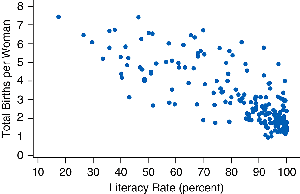
This scatterplot shows a negative trend: as literacy rate increases, total births per woman tends to decrease.
Example: No Trend
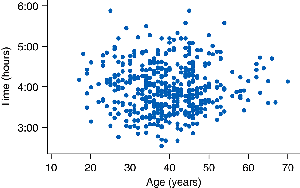
This scatterplot shows no trend: marathon running speed does not seem to be related to age of runner.
Example: Trend, Neither Positive nor Negative
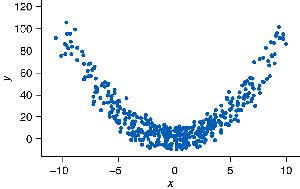
This data set shows an association between two variables, but it cannot be characterized as positive nor negative.
Strength of an Association
The strength of an association is determined by how closely the points cluster around the trend. Less scatter indicates a stronger association, while more scatter indicates a weaker association.
Strong Association: Points are tightly clustered around the trend.
Weak Association: Points are widely scattered.
Example: Strength of Association
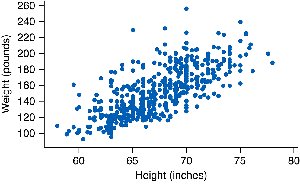
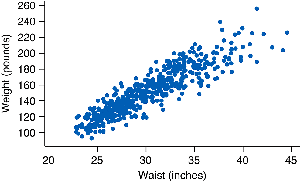
There is a stronger association between waist size and weight (less vertical variation) than between height and weight.
Shape of the Association
The shape describes whether the association is linear or non-linear:
Linear Association: The trend can be summarized with a straight line. Linear trends are common and increase or decrease at a constant rate.
Non-Linear Association: The trend is better modeled by a curve rather than a line.
Example: Linear Shape
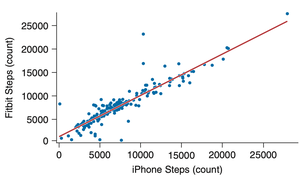
This scatterplot shows a linear association between steps counted by a Fitbit and steps counted by an iPhone.
Example: Non-Linear Shape
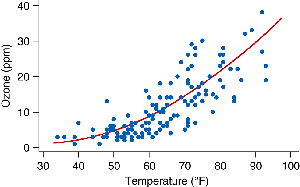
This scatterplot shows a non-linear trend between temperature and pollutant ozone levels.
Describing Associations
When describing associations between two numerical variables, always include the trend, shape, and strength, and explain what these mean in the context of the data. Mention any observations that do not fit the general trend (outliers).
Trend: Direction of association (positive, negative, none).
Shape: Linear or non-linear.
Strength: Strong or weak association.
Outliers: Points that do not fit the general pattern.
Example: Describing Associations
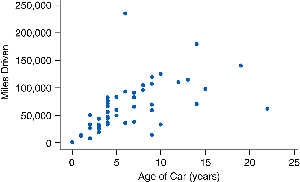
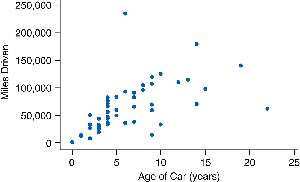
The association between the age and mileage of used cars is positive and linear. This means that older cars tend to have greater mileage. The association is moderately strong; some scatter is present but not enough to hide the shape of the relationship. There is one exceptional point: One car is only about 6 years old but has been driven many miles.
Best Practices for Describing Associations
Always use phrases like "tends to" when describing associations, as the trend may not be true for all individuals due to variability. Always point out any data points that appear to be unusual or not part of the general pattern.
Variability: Associations describe general tendencies, not absolute rules.
Outliers: Identify and discuss any unusual data points.
