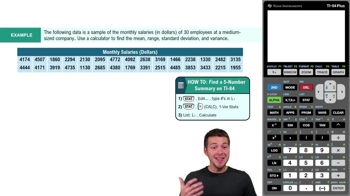
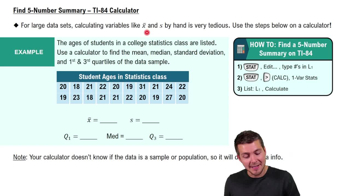
Describing Data Numerically Using a Graphing Calculator
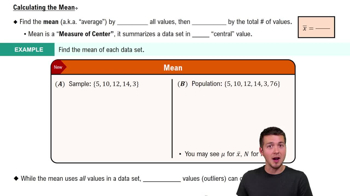
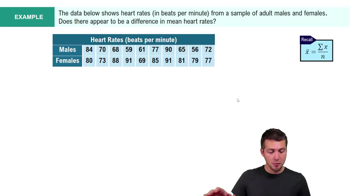
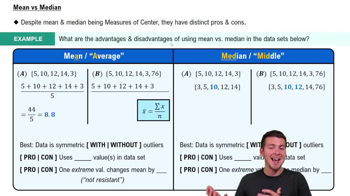
Mean
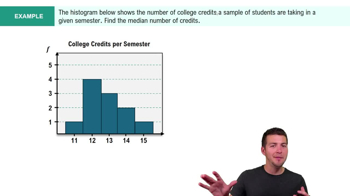
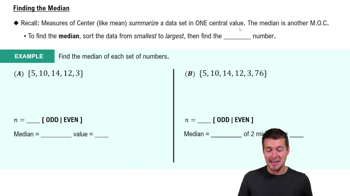
Median
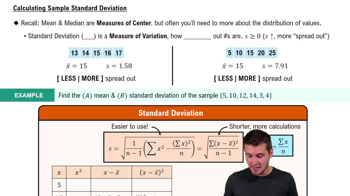
Standard Deviation
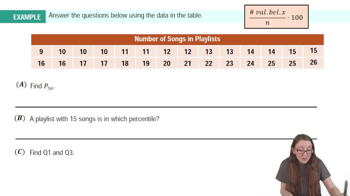
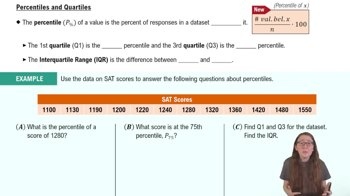
Percentiles & Quartiles
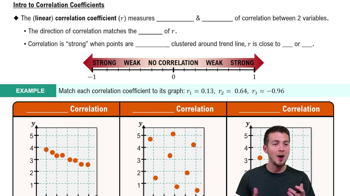
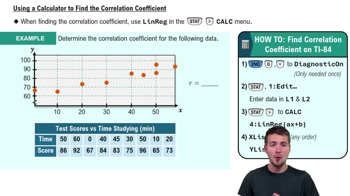
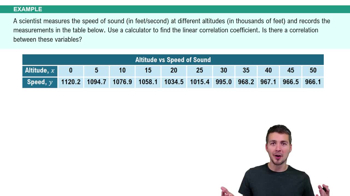
Correlation Coefficient
Correlation Coefficient
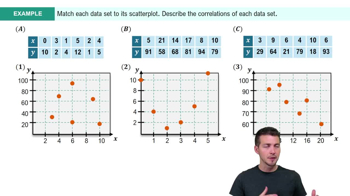
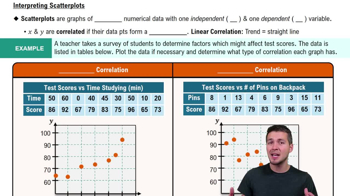
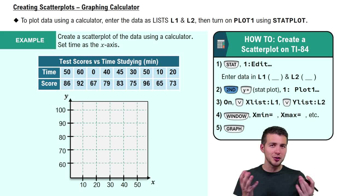
Scatterplots & Intro to Correlation
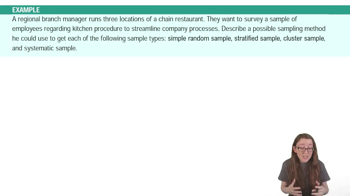
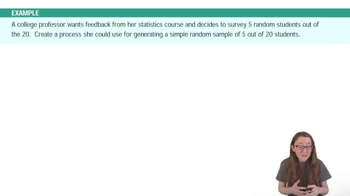
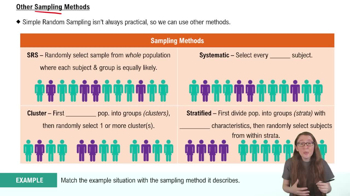
Sampling Methods
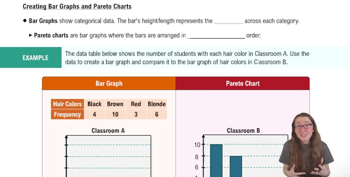
Bar Graphs and Pareto Charts
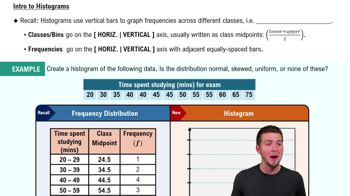
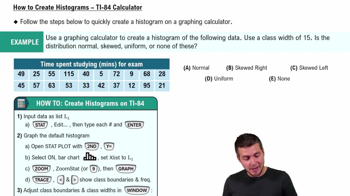
Histograms
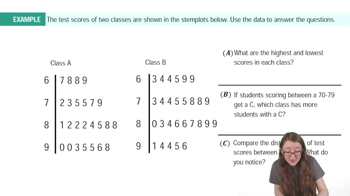
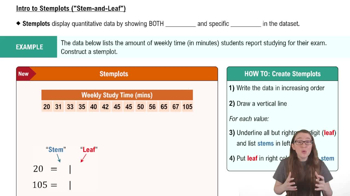
Stemplots (Stem-and-Leaf Plots)
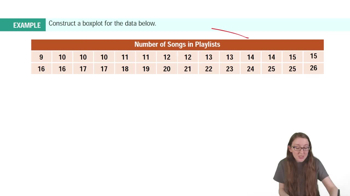
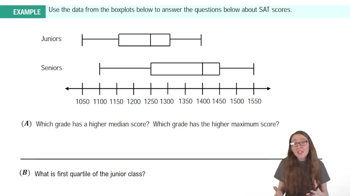
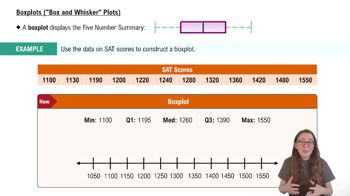
Boxplots
Boxplots
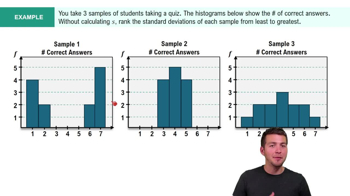
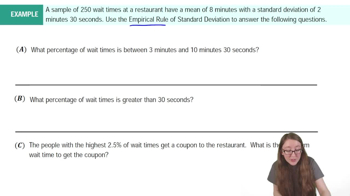
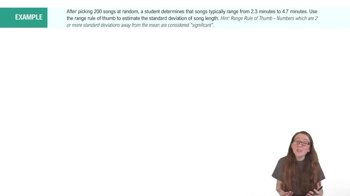
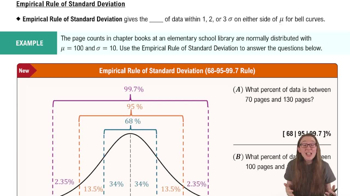
Interpreting Standard Deviation
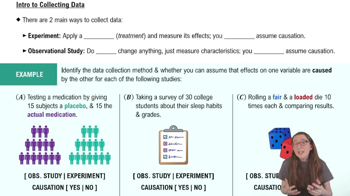
Intro to Collecting Data
Mean
Intro to Collecting Data
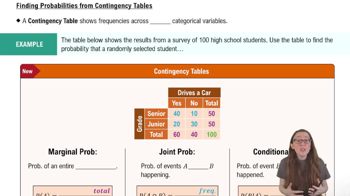
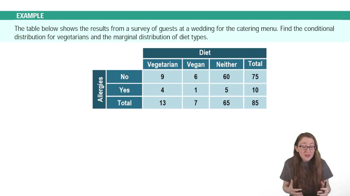
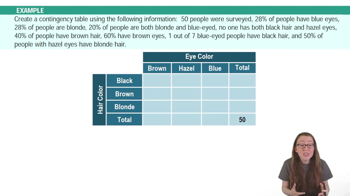
Introduction to Contingency Tables
Introduction to Contingency Tables
 뒤로
 업로드한 자료에 맞춘 엄선된 수업 – 모든 주제를 단계별로 배워보세요.
 05:45