 뒤로
Step-by-Step Guidance for Introductory Statistics Multiple Choice Review
스터디 가이드 - 스마트 노트
 자료에 맞춘 맞춤형 노트, 핵심 정의, 예시, 맥락을 확장해 제공합니다.
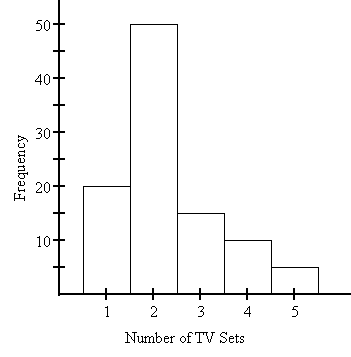
Q14. The histogram below represents the number of television sets per household for a sample of U.S. households. How many households are included in the histogram?
Background
Topic: Frequency Distributions and Histograms
This question tests your ability to interpret a histogram and understand how to calculate the total sample size from frequency data.
Key Terms:
Frequency: The number of occurrences of each value (in this case, the number of households with a certain number of TV sets).
Histogram: A graphical representation of the distribution of numerical data.
Step-by-Step Guidance
Examine the histogram and identify the frequency for each category (number of TV sets).
List the frequencies for each bar: for 1 TV set, 2 TV sets, 3 TV sets, 4 TV sets, and 5 TV sets.
Add up the frequencies for all categories to find the total number of households represented in the histogram.
Set up the addition:
Try solving on your own before revealing the answer!
Final Answer: 95 households
By reading the histogram, the frequencies are: 20 (1 TV), 50 (2 TVs), 15 (3 TVs), 10 (4 TVs), and 5 (5 TVs). Adding these gives households.
The total number of households is the sum of all frequencies shown in the histogram.
