 뒤로
Step-by-Step Study Guidance for Statistics Midterm (Part 1)
스터디 가이드 - 스마트 노트
 자료에 맞춘 맞춤형 노트, 핵심 정의, 예시, 맥락을 확장해 제공합니다.
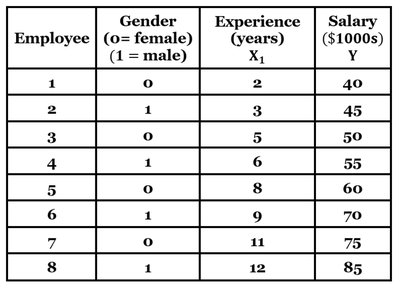
Q1. Using salary as the response variable, determine the multiple regression equation using experience and the dummy variable for gender. Then, use the equation to predict the salary for a female and male employee with 10 years of experience. Does gender appear to have a significant effect on salary?
Background
Topic: Multiple Regression & Dummy Variables
This question tests your understanding of how to build and interpret a multiple regression model using both quantitative (experience) and qualitative (gender) predictors. It also asks you to use the model for prediction and to assess the significance of a categorical variable.
Key Terms and Formulas
Multiple Regression Equation:
= Salary (response variable)
= Experience (years)
= Gender dummy variable (0 = female, 1 = male)
Dummy Variable: Used to represent categorical data numerically in regression
Step-by-Step Guidance
Examine the dataset and identify the variables: Salary (), Experience (), and Gender ().
Set up the regression equation using the given coefficients (from the question or calculated): .
To predict salary for a female employee with 10 years of experience, substitute and into the equation.
To predict salary for a male employee with 10 years of experience, substitute and into the equation.
To assess the effect of gender, compare the predicted salaries for and while keeping experience constant.
Try solving on your own before revealing the answer!
Final Answer:
Using the regression equation :
Female employee (10 years): ($1000s) = $70,870
Male employee (10 years): ($1000s) = $74,200
Gender does appear to have a significant effect on salary, as the coefficient for gender () increases the predicted salary for males compared to females with the same experience.
Q2. Which of the following best describes a census in the context of data collection?
Background
Topic: Data Collection Methods
This question tests your understanding of the definition of a census and how it differs from other sampling methods.
Key Terms
Census: A study that collects data from every individual in the population.
Sample: A subset of the population.
Step-by-Step Guidance
Review the definitions of census and sample.
Compare each answer choice to the definition of a census.
Eliminate options that refer to subsets, volunteers, or specific criteria.
Try solving on your own before revealing the answer!
Final Answer:
b. A census collects data from every individual in the population.
This is the correct definition of a census in statistics.
Q3. What sampling technique is used when a student interviews people leaving the cafeteria at lunchtime, and what are the potential sources of bias?
Background
Topic: Sampling Methods & Bias
This question tests your ability to identify sampling techniques and recognize potential sources of bias in survey data.
Key Terms
Convenience Sampling: Selecting individuals who are easiest to reach.
Bias: Systematic error that affects the representativeness of the sample.
Step-by-Step Guidance
Identify the sampling method: The student interviews people who are conveniently available.
Consider whether the sample is representative of the entire population.
Think about potential biases: Are certain groups over- or under-represented?
Try solving on your own before revealing the answer!
Final Answer:
d. Convenience sampling; non-representative sample bias.
Convenience sampling often leads to bias because the sample may not represent the broader population.
Q4. What is the most appropriate type of graph to visualize annual average rainfall data recorded over 100 years?
Background
Topic: Data Visualization
This question tests your ability to select the correct graph for visualizing quantitative, time-series data.
Key Terms
Line Graph: Used to display data points over time.
Scatterplot: Shows relationships between two quantitative variables.
Bar Graph: Used for categorical data.
Pie Chart: Used for proportions of categories.
Step-by-Step Guidance
Identify the type of data: Quantitative and measured over time.
Recall which graph is best for time-series data.
Eliminate graphs that are not suitable for continuous, time-based data.
Try solving on your own before revealing the answer!
Final Answer:
c. Line Graph
Line graphs are ideal for visualizing trends in quantitative data over time.
Q5. Construct a frequency distribution for the weights of high school seniors, starting with a lower-class limit of 45 kg and a class width of 10 kg. Can we conclude that the distribution appears to be normal?
Background
Topic: Frequency Distributions & Normality
This question tests your ability to construct a frequency distribution and assess whether the data appears to follow a normal distribution.
Key Terms
Frequency Distribution: Table showing how data are distributed across intervals.
Normal Distribution: Symmetrical, bell-shaped distribution.
Class Width: The difference between the lower limits of consecutive classes.
Step-by-Step Guidance
List the weights and organize them into classes starting at 45 kg with a width of 10 kg.
Count the frequency of weights in each class interval.
Examine the shape of the distribution: Is it symmetrical and bell-shaped?
Try solving on your own before revealing the answer!
Final Answer:
a. Yes, the distribution appears normal.
The frequencies are highest in the middle classes and taper off at the extremes, suggesting a normal distribution.
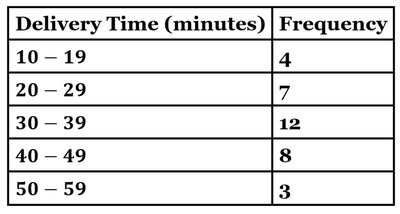
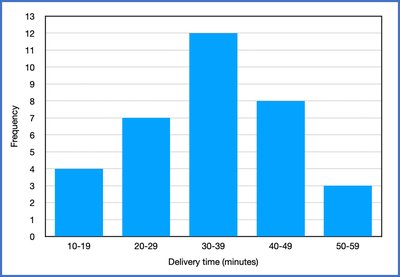
Q6. Construct the histogram corresponding to the delivery time frequency distribution. Which best describes the distribution: uniform, normal, skewed left, or skewed right?
Background
Topic: Histograms & Distribution Shapes
This question tests your ability to interpret histograms and identify the shape of a distribution.
Key Terms
Histogram: A bar graph for quantitative data showing frequency for intervals.
Distribution Shape: Describes how data are spread (normal, skewed, uniform).
Step-by-Step Guidance
Review the frequency distribution table for delivery times.
Construct the histogram by plotting frequency for each interval.
Examine the histogram for symmetry, peaks, and tails.
Compare the shape to definitions of normal, skewed left, skewed right, and uniform distributions.
Try solving on your own before revealing the answer!
Final Answer:
a. Skewed left
The histogram shows a peak in the middle and a longer tail on the left, indicating a left-skewed distribution.
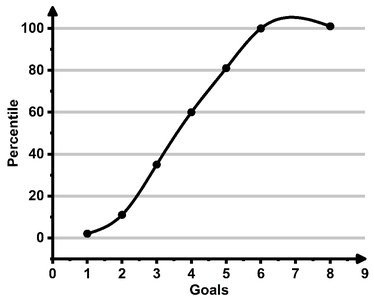
Q18. The goals scored by winning teams in a football tournament final are represented in the ogive below. What score represents the 60th percentile? What interpretation could be drawn from this?
Background
Topic: Percentiles & Ogives
This question tests your ability to read an ogive (cumulative frequency graph) and interpret percentiles.
Key Terms
Ogive: A graph showing cumulative frequencies or percentiles.
Percentile: The value below which a given percentage of observations fall.
Step-by-Step Guidance
Locate the 60th percentile on the y-axis of the ogive.
Draw a horizontal line from the 60th percentile to the curve, then a vertical line down to the x-axis (goals).
Read the corresponding number of goals at the intersection.
Interpret what this means: What proportion of teams scored at or below this number?
Try solving on your own before revealing the answer!
Final Answer:
b. The 60th percentile corresponds to 4 goals.
This means that 60% of the winning teams scored 4 goals or fewer, and 40% scored more than 4 goals.
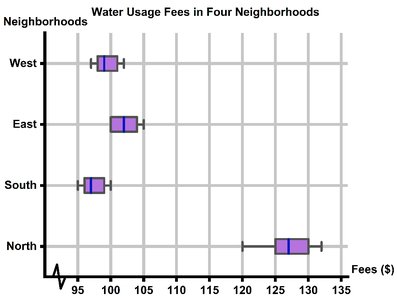
Q20. Does it seem like North has higher water usage fees than other neighborhoods? Use the box and whisker plot diagram below.
Background
Topic: Boxplots & Comparing Groups
This question tests your ability to interpret boxplots and compare medians and ranges between groups.
Key Terms
Boxplot: A graphical summary of data showing median, quartiles, and outliers.
Median: The middle value of a dataset.
Step-by-Step Guidance
Examine the boxplot for each neighborhood, focusing on the median line inside each box.
Compare the position of the median for North to the other neighborhoods.
Consider the spread (range) and whether North's box is higher than the others.
Try solving on your own before revealing the answer!
Final Answer:
a. Yes, North has the highest median.
The boxplot shows that North's median water usage fee is higher than the other neighborhoods, supporting the residents' complaint.
