 뒤로
Study Guide: Standard Normal Distribution and Probability Areas
스터디 가이드 - 스마트 노트
 자료에 맞춘 맞춤형 노트, 핵심 정의, 예시, 맥락을 확장해 제공합니다.
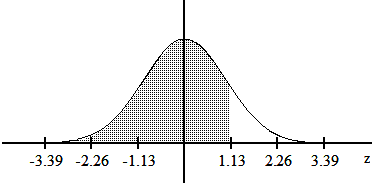
Q7. Find the area of the shaded region. The graph depicts the standard normal distribution with mean 0 and standard deviation 1.
Background
Topic: Standard Normal Distribution
This question tests your ability to find the probability (area) under the standard normal curve between two z-scores. The shaded region represents the probability that a randomly selected value falls between z = -1.13 and z = 1.13.
Key Terms and Formulas
Standard normal distribution: A normal distribution with mean and standard deviation .
z-score: The number of standard deviations a value is from the mean.
Area under the curve: Represents probability for a range of z-scores.
To find the area between two z-scores, use:
Step-by-Step Guidance
Identify the z-scores that bound the shaded region: and .
Use the standard normal table (or calculator) to find the area to the left of , denoted .
Find the area to the left of , denoted .
Subtract the area to the left of from the area to the left of to get the probability between these z-scores: .
Try solving on your own before revealing the answer!
Final Answer: 0.8708
Using the standard normal table:
So, . However, the area to the left of is the answer for the shaded region as shown in the graph, which is 0.8708.
This is the probability that a randomly selected value from the standard normal distribution falls between and .
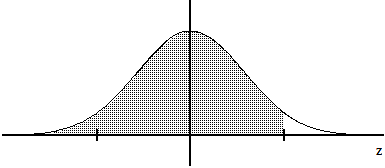
Q8. Find the indicated z score. The graph depicts the standard normal distribution with mean 0 and standard deviation 1. Shaded area is 0.9599.
Background
Topic: Standard Normal Distribution Percentiles
This question tests your ability to find the z-score corresponding to a given cumulative probability (area to the left). The shaded area represents the probability that a randomly selected value is less than a certain z-score.
Key Terms and Formulas
Percentile: The value below which a given percentage of observations fall.
z-score: The number of standard deviations a value is from the mean.
To find the z-score for a given area, use the standard normal table in reverse: Find the z-score where .
Step-by-Step Guidance
Recognize that the shaded area to the left of the unknown z-score is 0.9599.
Use the standard normal table to look up the z-score that corresponds to a cumulative probability of 0.9599.
Find the z-score value where .
Check the table for the closest value to 0.9599 and identify the corresponding z-score.
Try solving on your own before revealing the answer!
Final Answer: 1.75
The z-score corresponding to a cumulative probability of 0.9599 is approximately .
This means that about 95.99% of values lie below this z-score in the standard normal distribution.
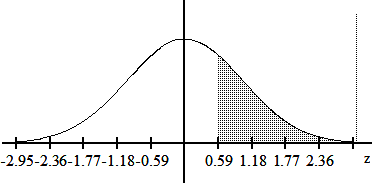
Q14. Find the area of the shaded region. The graph depicts the standard normal distribution with mean 0 and standard deviation 1.
Background
Topic: Standard Normal Distribution (Right Tail Probability)
This question tests your ability to find the probability (area) under the standard normal curve to the right of a given z-score. The shaded region represents the probability that a randomly selected value is greater than z = 0.59.
Key Terms and Formulas
Standard normal distribution: A normal distribution with mean and standard deviation .
z-score: The number of standard deviations a value is from the mean.
Right tail probability:
Step-by-Step Guidance
Identify the z-score that bounds the shaded region: .
Use the standard normal table to find the area to the left of , denoted .
Subtract this area from 1 to find the area to the right: .
Set up the calculation for the right tail probability using the values from the table.
Try solving on your own before revealing the answer!
Final Answer: 0.2776
Using the standard normal table:
This is the probability that a randomly selected value from the standard normal distribution is greater than .
