뒤로

Summarizing and Graphing Data (Introductory Statistics Ch. 2)

학습 가이드 - 영상으로 배우기

업로드한 자료에 맞춘 엄선된 수업 – 모든 주제를 단계별로 배워보세요.

Frequency Distributions

  • 가이드 코스
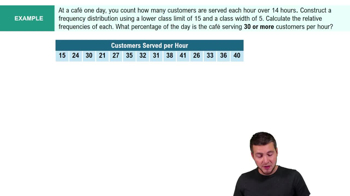
    Intro to Frequency Distributions Example 1
    06:19
  • 가이드 코스
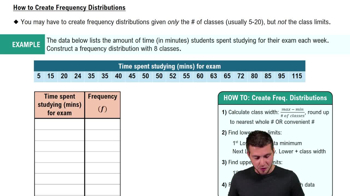
    How to Create Frequency Distributions
    06:29
  • 가이드 코스
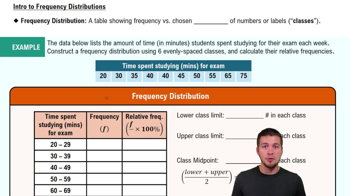
    Intro to Frequency Distributions
    06:38

Histograms

  • 가이드 코스
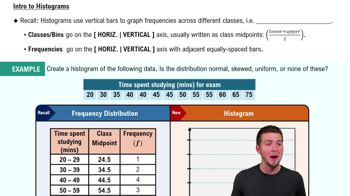
    Intro to Histograms
    05:54
  • 가이드 코스
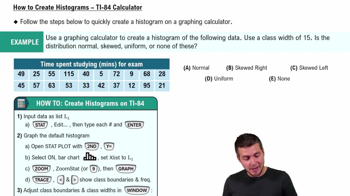
    How to Create Histogram - TI-84 Calculator
    07:10

Dot Plots

  • 가이드 코스
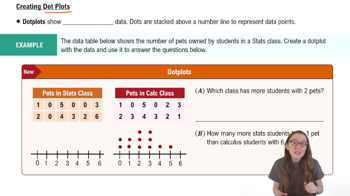
    Creating Dotplots
    04:01

Stemplots (Stem-and-Leaf Plots)

  • 가이드 코스
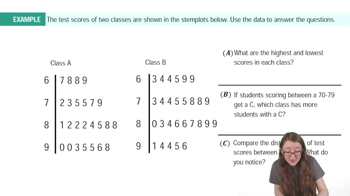
    Stemplots Example 1
    06:09
  • 가이드 코스
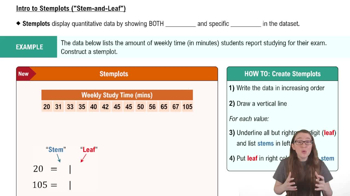
    Creating Stemplots
    06:23

Frequency Polygons

  • 가이드 코스
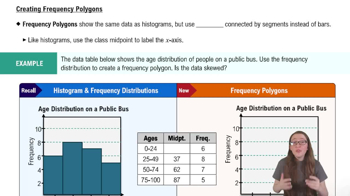
    Creating Frequency Polygons
    04:41
  • 가이드 코스
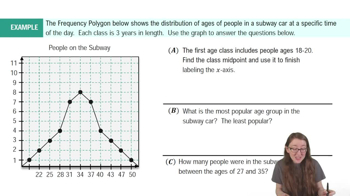
    Frequency Polygons Example 1
    04:15

Time-Series Graph

  • 가이드 코스
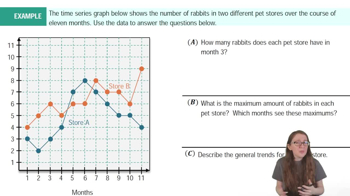
    Time-Series Graphs Example 1
    04:36
  • 가이드 코스
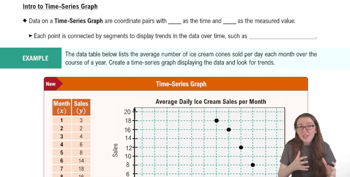
    Creating Time-Series Graphs
    04:13

Scatterplots & Intro to Correlation

  • 가이드 코스
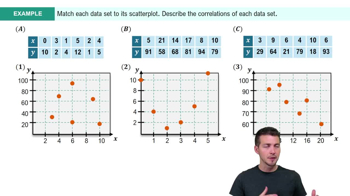
    Scatterplots & Intro to Correlation Example 1
    05:14
  • 가이드 코스
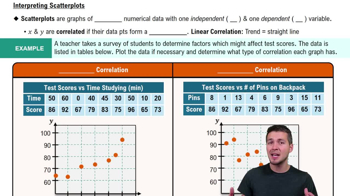
    Scatterplots & Intro to Correlation
    06:36
  • 가이드 코스
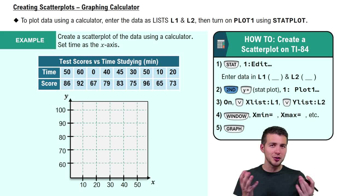
    Creating Scatterplots - Graphing Calculator
    05:26