 뒤로
뒤로Metric System and Measurement in Anatomy & Physiology
스터디 가이드 - 스마트 노트
 자료에 맞춘 맞춤형 노트, 핵심 정의, 예시, 맥락을 확장해 제공합니다.
Introduction to the Metric System
The metric system is a decimal-based system of measurement used globally in science and medicine, including Anatomy & Physiology. Its simplicity comes from having one base unit for each type of measurement, with prefixes indicating multiples or fractions of these units. Understanding the metric system is essential for accurate measurement and data interpretation in biological sciences.
Metric Base Units and Prefixes
Base Units
Length: meter (m)
Mass: gram (g)
Volume: liter (L)
These units are the foundation for most measurements in Anatomy & Physiology.
Common Metric Prefixes
Prefix Name | Symbol | Value | Scale |
|---|---|---|---|
nano | n | 1/1,000,000,000 | billionth |
micro | µ | 1/1,000,000 | millionth |
milli | m | 1/1,000 | thousandth |
centi | c | 1/100 | hundredth |
deci | d | 1/10 | tenth |
deca | da | 10 | ten |
hecto | h | 100 | hundred |
kilo | k | 1,000 | thousand |
Prefixes are combined with base units to express different scales, e.g., milligram (mg), kilometer (km).
Scientific Notation
Definition and Use
Scientific notation is a method for expressing very large or very small numbers in the form a x 10n, where a is a number between 1 and 10, and n is an integer. This notation simplifies calculations and data presentation in science.
Move the decimal to create a number between 1 and 10.
The number of places moved determines the exponent.
Left = positive exponent; Right = negative exponent.
Example: 0.0042 = 4.2 x 10⁻³
Metric Conversions Using Dimensional Analysis
Dimensional Analysis Method
Dimensional analysis is a systematic approach to converting between units by multiplying by conversion factors. This method ensures accuracy in calculations, especially in clinical and laboratory settings.
Write the given quantity as a fraction.
Multiply by conversion factors so that units cancel appropriately.
Multiply numerators and denominators, then simplify.
Example: Convert 120 mg/dL to mg/mL.
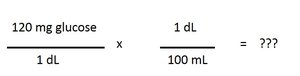

Result:
Converting Between English and Metric Units
Length, Volume, and Mass Conversions
In the United States, English units are often used, requiring conversion to metric units for scientific work. Common conversion factors include:
1 inch = 2.54 centimeters
1 kilogram = 2.2 pounds
Example: Convert 65 inches to meters.
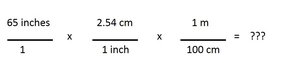
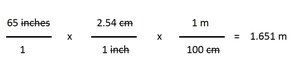
Result:
Temperature Conversions
Fahrenheit to Celsius:
Celsius to Fahrenheit:
Key Reference Temperatures:
Event | Fahrenheit (°F) | Celsius (°C) |
|---|---|---|
Average body temperature | 98.6 | 37 |
Freezing point of water | 32 | 0 |
Boiling point of water | 212 | 100 |
Measuring Length, Volume, and Mass
Common Laboratory Tools
Length: Measured with a meter stick or ruler (cm, mm)
Volume: Measured with graduated cylinders or beakers (mL, L)
Mass: Measured with a balance (g, kg)
Accurate measurement is essential for experimental reliability and clinical calculations.
Graphing Data
Basics of Graphs
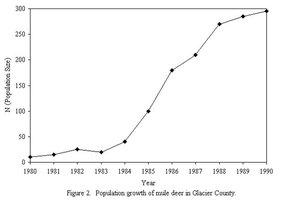
Graphs visually represent data, making it easier to identify trends and relationships. The x-axis (horizontal) typically shows the independent variable, while the y-axis (vertical) shows the dependent variable. Both axes must be labeled with the variable and units.
Types of Graphs
Line Graph: Shows changes over time by connecting data points with lines.
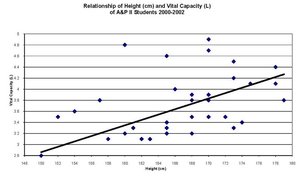
Scatter Plot: Displays the relationship between two variables; a trend line may indicate correlation.
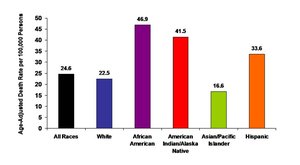
Bar Graph: Compares quantities across categories using separate bars.
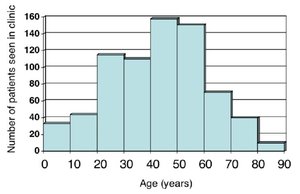
Histogram: Similar to a bar graph but used for continuous data; bars touch each other.
Examples:
Line Graph: Population growth over time.
Scatter Plot: Relationship between height and vital capacity.
Bar Graph: Age-adjusted death rates by demographic group.
Histogram: Distribution of patient ages in a clinic.
Graphing in Anatomy & Physiology
Graphing is used to analyze physiological data, such as blood glucose levels over time or the relationship between physical characteristics and health outcomes. Proper graph selection and labeling are crucial for clear data interpretation.
Appendix: Common Metric Units and Symbols
Measurement | Unit Name | Symbol |
|---|---|---|
Length | meter, centimeter, millimeter | m, cm, mm |
Mass | gram, kilogram | g, kg |
Time | second | s |
Temperature | degree Celsius | °C |
Area | square meter, square centimeter | m2, cm2 |
Volume | liter, milliliter | L, mL |
Density | kilogram per cubic meter | kg/m3 |
Force | newton | N |
Electric current | ampere | A |
Memory Device for Celsius: "When it's zero it's freezing, when it's 10 it's not, when it's 20 it's warm, when it's 30 it's hot!"
Additional info: Mastery of the metric system and graphing is foundational for success in Anatomy & Physiology, as these skills are used in laboratory measurements, clinical calculations, and data analysis throughout the course.
