 뒤로
뒤로Introduction to Biology and Scientific Inquiry: Study Guide
스터디 가이드 - 스마트 노트
 자료에 맞춘 맞춤형 노트, 핵심 정의, 예시, 맥락을 확장해 제공합니다.
Introduction to Biology
What is Life?
Biology is the scientific study of life. Life is characterized by several fundamental properties that distinguish living organisms from non-living matter.
Membrane delimited: All living things are bounded by membranes that separate their internal environment from the external environment.
Information storage and transmission: Life stores and transmits instructions, primarily through genetic material such as DNA.
Energy transformation and use: Living organisms store, transform, and utilize energy to maintain their functions.
Response to environment: Life controls its functions and responds to environmental changes.
Self-replication: Living organisms are capable of reproducing themselves.
Evolution: Life evolves over generations through genetic changes and natural selection.
Biomolecules: The properties of life are facilitated by complex molecules such as proteins, nucleic acids, lipids, and carbohydrates.
Cellular basis: The cell is the smallest unit of life.
Example: A bacterium is a single-celled organism that can grow, reproduce, respond to its environment, and evolve over time.
Fundamental Concepts in Biology
Building Knowledge
Biology builds upon fundamental concepts, and understanding these basics is essential for success in advanced topics. Consistent study habits and seeking help early are crucial for mastering the material.
Active learning: Engage with the material through drawing, concept mapping, and self-testing.
Collaboration: Study groups and attending office hours can enhance understanding.
Application: The foundational knowledge gained in introductory biology is essential for advanced courses and standardized exams (e.g., MCAT, DAT, GRE).

Effective Study Habits in Biology
Study Patterns and Memory
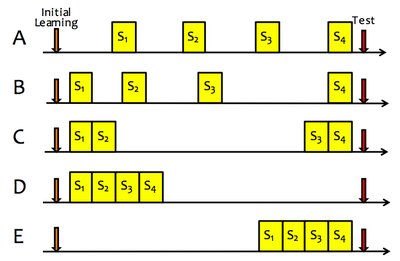
Biologists use figures and models to explain complex mechanisms. Similarly, effective study habits can be modeled to maximize retention and understanding.
Forgetting curve: More than 50% of learned information can be forgotten within one hour if not reinforced.
Distributed practice: Spacing out study sessions over time leads to better long-term retention compared to cramming.
Self-testing: Testing yourself on the material is more effective than passive review.
Data Interpretation and Graphs in Biology
Understanding Variables and Graphs
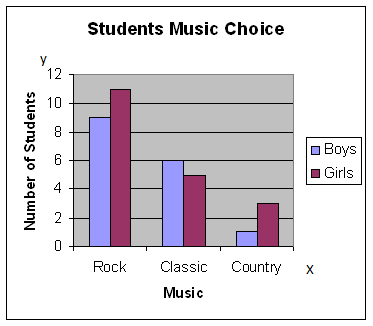
Biologists often use graphs to present data and analyze relationships between variables.
Independent variable (x-axis): The factor that is manipulated or categorized, such as time or treatment group.
Dependent variable (y-axis): The measured outcome that depends on the independent variable, such as growth or response.
Types of graphs: Bar graphs, line graphs, and scatter plots are commonly used to visualize data.
Experimental Variable (Independent Variable) | Responding Variable (Dependent Variable) |
|---|---|
Factor of the experiment being tested | Result or change that occurs due to the experimental variable |
The Scientific Method
Steps of Scientific Inquiry
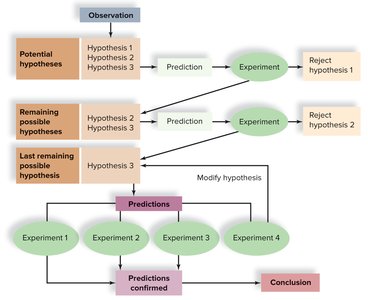
The scientific method is a systematic approach used to investigate natural phenomena and answer scientific questions.
Observation: Gathering information about the natural world.
Hypothesis: A testable explanation for an observation.
Prediction: A logical statement about what will happen if the hypothesis is correct.
Experiment: A controlled test to evaluate the hypothesis, including a control group and experimental group.
Analysis: Interpreting data to determine if the hypothesis is supported or rejected.
Conclusion: Summarizing findings and considering further questions or experiments.

Controls in Experiments
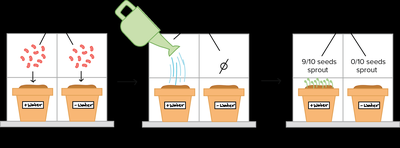
A control group is a subset of subjects in an experiment that does not receive the experimental treatment. It serves as a baseline for comparison, ensuring that observed effects are due to the variable being tested.
Example: In a cake-baking experiment to test the effect of baking powder, the control group would use the recipe without baking powder.
Application Example: Tomato Plants
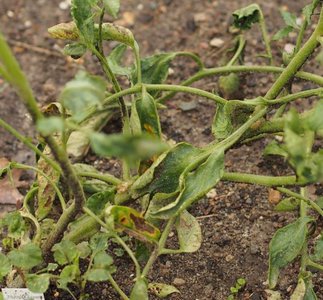
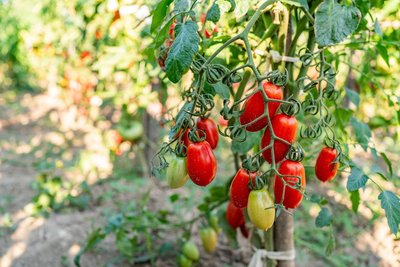
Suppose you observe that your neighbor's tomato plants are healthier than yours. You hypothesize that a specific factor (e.g., amount of sunlight or water) is responsible. You design an experiment with a control group to test your hypothesis.
Experimental Design Example
Consider an experiment testing whether water is necessary for seed germination. The experimental group receives water, while the control group does not. The results are compared to determine the effect of water on germination.
Summary Table: Scientific Method Steps
Step | Description | Example |
|---|---|---|
Observation | Notice a phenomenon | Tomato plants grow differently |
Hypothesis | Propose an explanation | Sunlight affects growth |
Prediction | State expected outcome | Plants with more sunlight will grow taller |
Experiment | Test the hypothesis | Grow plants with different sunlight levels |
Analysis | Interpret results | Compare plant heights |
Conclusion | Accept or reject hypothesis | Sunlight increases growth |
Additional info: The scientific method is iterative; hypotheses may be revised based on experimental results, and new questions may arise from conclusions.
