 뒤로
뒤로Population Dynamics and Human Population Growth
스터디 가이드 - 스마트 노트
 자료에 맞춘 맞춤형 노트, 핵심 정의, 예시, 맥락을 확장해 제공합니다.
Population Dynamics
Levels of Biological Organization
Understanding population dynamics begins with recognizing the hierarchical structure of biological organization:
Biosphere: The sum of all ecosystems on Earth; extremely complex and difficult to study as a whole.
Ecosystem: A community of organisms interacting with their physical environment (both living and non-living components).
Community: Groups of different species that occupy the same geographic area and interact.
Population: Groups of individuals of the same species occupying the same geographic area and interacting with each other.
Characteristics of Populations
Distribution (Geographic Range): The area where a population is found, determined by suitability for growth and survival.
Population Density: The number of individuals per unit area or volume. Density is higher in areas with plentiful resources. Generally, larger organisms have lower population densities, while smaller organisms have higher densities.
Changes in Population Size
Population size changes as a result of births and deaths:
Growth Rate: The rate at which a population increases or decreases. Calculated as:
Positive growth rate: Population increases.
Negative growth rate: Population decreases.
Biotic Potential
Biotic potential is the maximum rate of population growth under ideal conditions. It depends on:
Number of offspring per reproductive cycle
Frequency of reproduction
Age at first reproduction
Ratio of males to females
Abundance of resources (food, water, habitat, etc.)
Doubling Time of a Population
The time required for a population to double in size can be estimated using the rule of 72:
Example: If a population grows at 3% per year, doubling time is years.
Exponential Growth
Exponential (theoretical) growth occurs under ideal conditions with unlimited resources. The population doubles at regular intervals, producing a J-shaped curve:
Lag phase: Slow initial growth due to small population size.
Exponential phase: Rapid acceleration in growth.
Environmental Resistance and Logistic Growth
In reality, populations cannot grow indefinitely. Environmental resistance (limited resources, competition, predation, disease) slows growth, leading to logistic (S-shaped) growth:
Lag phase
Exponential phase
Deceleration phase: Growth slows as competition increases.
Stable equilibrium: Population size stabilizes near the carrying capacity (the maximum population size the environment can support indefinitely).
Carrying Capacity
Population size fluctuates around carrying capacity, adjusting as environmental conditions change.
Factors Regulating Population Growth
Density-Independent Factors: Affect populations regardless of size (e.g., weather, natural disasters).
Density-Dependent Factors: Impact increases with population density (e.g., competition, predation).
Competition and Predation
Competition: Members of the same species compete for limited resources; not all will survive or reproduce.
Predation: Predators consume prey; as prey populations increase, predation becomes more effective.
Patterns in Ecology
Opportunistic Species: Exhibit exponential growth, small size, early maturity, short lifespan, little parental care; regulated mainly by density-independent factors.
Equilibrium Species: Exhibit logistic growth, larger size, slow maturity, long lifespan, high parental investment; regulated mainly by density-dependent factors. More prone to extinction.
Human Population Growth
Historical Trends
Human population remained low and stable (~10 million) for most of history.
Population began to rise with the advent of agriculture and animal domestication (~4,000 years ago).
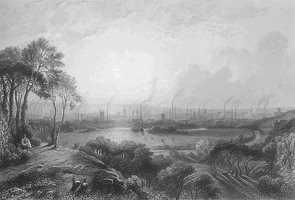
Rapid growth occurred during the Industrial Revolution (1700s) and continues today, with little environmental resistance due to technological advances.
Zero Population Growth
Current global growth rate: ~0.82% per year; next doubling in ~88 years.
Zero population growth: Births equal deaths.
Achieved by decreasing birth rates or increasing death rates.
Fertility Rates
Fertility rate: Average number of children born to each female during her lifetime.
Global fertility peaked at 5.32 (1963); declined to 2.32 (2021).
Replacement fertility rate: 2.1 children per woman (needed for zero population growth).
If achieved, population could stabilize at 9.7 billion by 2050 and 10.9 billion by 2100.
Regional Differences in Growth
Region | Growth Pattern | Key Factors |
|---|---|---|
More Developed Countries (MDCs) | Rapid growth (1850-1950), modest growth since 1950s | Improved sanitation, medicine, lower death and birth rates |
Less Developed Countries (LDCs) | Dramatic growth, especially post-WWII | Modern medicine lowered death rates, birth rates remain high, many live in poverty |
Extinction
Extinction: Total loss of a species. Equilibrium species are at higher risk due to their life history traits.
References: Johnson, M.D. (2017); Mader & Windelspecht (2012); Our World in Data (2023); Wikimedia Commons by Edward Goodall.
