 뒤로
뒤로Analyzing Local Extrema from a Graph
스터디 가이드 - 스마트 노트
 자료에 맞춘 맞춤형 노트, 핵심 정의, 예시, 맥락을 확장해 제공합니다.
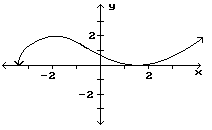
Q14. Find the location and value of each local extremum for the function shown in the graph.
Background
Topic: Local Extrema (Maximum and Minimum) from Graphs
This question tests your ability to identify local maxima and minima by analyzing the graph of a function. Local extrema are points where the function changes direction, i.e., from increasing to decreasing (maximum) or decreasing to increasing (minimum).
Key Terms and Formulas:
Local Maximum: A point where is higher than all nearby points.
Local Minimum: A point where is lower than all nearby points.
Critical Point: Where or is undefined.
Step-by-Step Guidance
Examine the graph and identify points where the curve changes from increasing to decreasing (local maxima) and from decreasing to increasing (local minima).
Look for peaks (highest points in a neighborhood) and valleys (lowest points in a neighborhood) along the curve. These are typically where the tangent is horizontal.
Label each extremum with its -coordinate (e.g., ) and estimate the corresponding -value from the graph.
Check if any endpoints or isolated points could also be considered local extrema, depending on the graph's behavior.
Try solving on your own before revealing the answer!
Final Answer:
Local maxima occur at (with corresponding -values from the graph), and local minima occur at (with corresponding $y$-values). The exact values can be read from the graph at these points.
Each extremum is where the curve changes direction, and the tangent is horizontal.
