 뒤로
뒤로Functions and Graphs: Linear and Quadratic Functions in Business Calculus 1.3
스터디 가이드 - 스마트 노트
 자료에 맞춘 맞춤형 노트, 핵심 정의, 예시, 맥락을 확장해 제공합니다.
Functions and Graphs
Mathematical Modeling
Mathematical modeling is the process of using mathematics to represent, analyze, and solve real-world problems. This process is fundamental in business calculus for making informed decisions based on quantitative data.
Step 1: Construct the mathematical model – Translate the real-world scenario into mathematical language (equations, functions, etc.).
Step 2: Solve the mathematical model – Use algebraic or calculus techniques to find solutions.
Step 3: Interpret the solution – Relate the mathematical results back to the original context to make practical decisions.
Often, the modeling process is iterative, requiring refinement of the model for accuracy.
Linear Functions and Equations
Definition of a Linear Equation
A linear equation in two variables is any equation that can be written in the form:
A, B, and C are constants, with A and B not both zero.
x and y are variables.
The graph of a linear equation is always a straight line.
Slope of a Line
The slope of a line measures its steepness and direction. For a line passing through points and , the slope is:
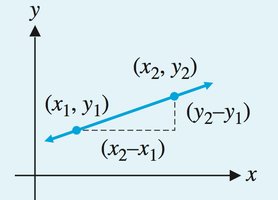
Geometric Interpretation of Slope
The slope of a line can be interpreted as follows:
Positive slope: Line rises as increases.
Negative slope: Line falls as increases.
Zero slope: Line is horizontal.
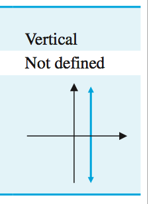
Undefined slope: Line is vertical.
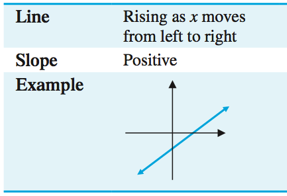
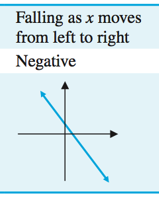
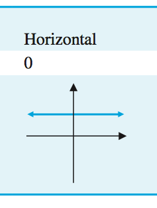
Equations of a Line
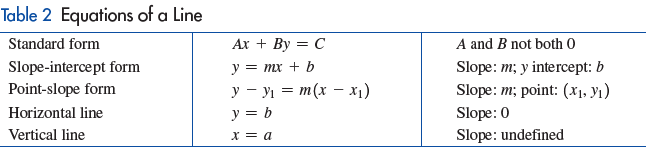
There are several common forms for the equation of a line:
Form | Equation | Notes |
|---|---|---|
Standard form | and not both 0 | |
Slope-intercept form | Slope: ; y-intercept: | |
Point-slope form | Slope: ; point: | |
Horizontal line | Slope: 0 | |
Vertical line | Slope: undefined |
Applications: Linear Function Modeling
Linear functions are used to model relationships with constant rates of change, such as cost, revenue, and break-even analysis in business.
Cost function: (fixed cost plus variable cost per unit)
Revenue function: (selling price per unit times number of units sold)
Break-even point: Solve for
Example: For the t-shirt scenario, the break-even point is found by solving , yielding shirts (rounded to the nearest whole number).
Interval Notation
Representing Intervals
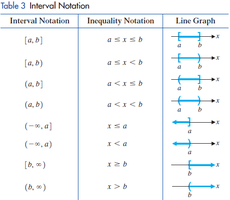
Interval notation is a concise way to describe sets of real numbers, especially those defined by inequalities.
Interval Notation | Inequality Notation | Line Graph |
|---|---|---|
[a, b] | Closed interval | |
(a, b) | Open interval | |
[a, b) | Half-open interval | |
(a, b] | Half-open interval | |
(, a) | Unbounded below | |
(b, ) | Unbounded above |
Quadratic Functions
Definition and Properties
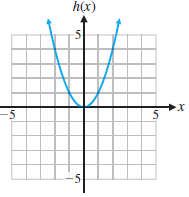
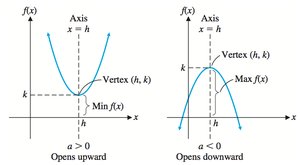
A quadratic function is any function of the form , where . The graph of a quadratic function is a parabola.
Domain: All real numbers
Range: Depends on whether the parabola opens upward () or downward ()
Vertex: The highest or lowest point on the graph
Axis of symmetry: Vertical line through the vertex,
Vertex Form of a Quadratic Function
The vertex form of a quadratic function is:
Vertex:
If , the parabola opens upward (minimum at vertex)
If , the parabola opens downward (maximum at vertex)
Finding the Vertex by Completing the Square
To convert to vertex form, complete the square:
Example:
Step-by-step:
Factor from
Add and subtract 1 inside the parentheses to complete the square
Rewrite as
The vertex is at .
Intercepts of a Quadratic Function
y-intercept: Set and solve for .
x-intercepts (zeros): Set and solve the quadratic equation for .
Solving Quadratic Inequalities
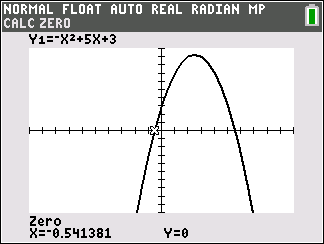
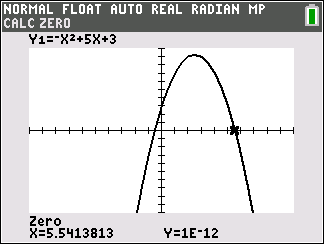
To solve inequalities like , find the x-values where the graph is above the x-axis (i.e., where ).
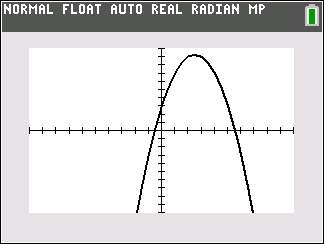
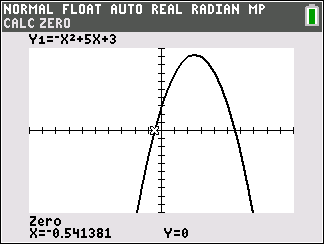
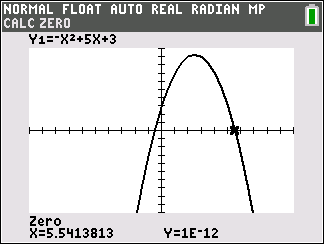
The solution in interval notation is .
Applications of Quadratic Functions
Modeling Maximum Yield
Quadratic functions are used to model scenarios with a maximum or minimum value, such as maximizing crop yield or profit.
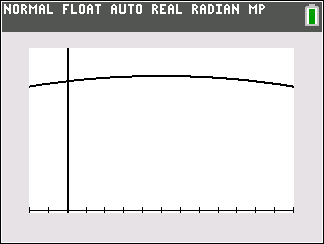
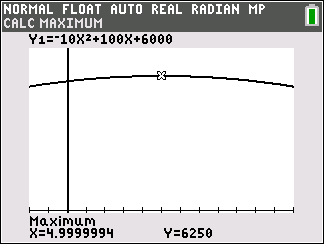
Example: A farmer plants additional trees, but each new tree reduces the yield per tree. The total yield as a function of additional trees is:
The vertex gives the maximum yield. Completing the square or using a calculator shows the vertex at , so planting 5 more trees yields the maximum of 6250 peaches.
Break-Even Analysis with Quadratic and Linear Functions
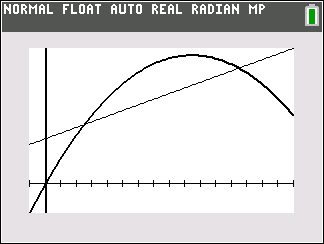
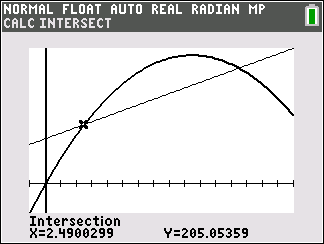
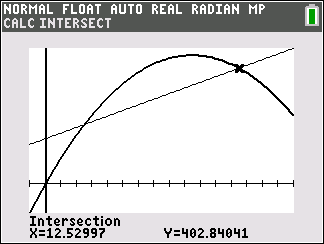
Break-even analysis determines the production level where revenue equals cost. For example, with:
(revenue function)
(cost function)
Set and solve for :
Solutions: or (in millions of cameras).
Regression Analysis
Linear Regression
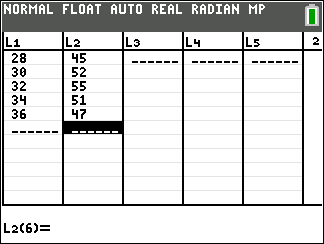
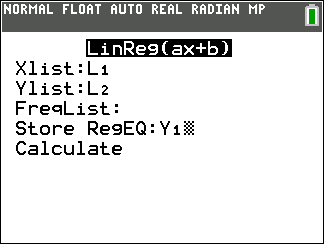
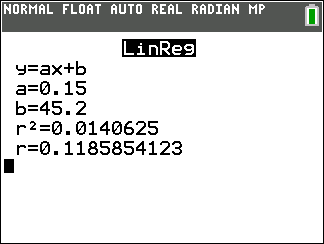
Linear regression finds the best-fit line for a set of data points, modeling the relationship between two variables. The equation is .
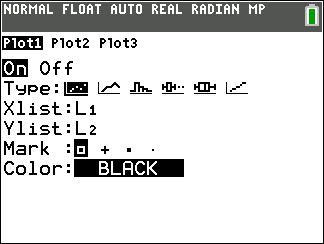
Input data into lists (e.g., L1 for , L2 for ).
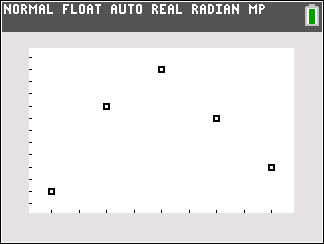
Create a scatter plot to visualize the data.
Use calculator/statistical software to compute the regression line.
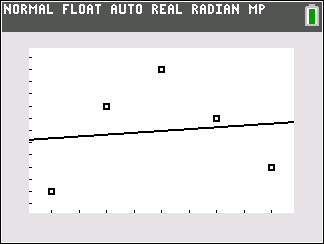
Quadratic Regression
Quadratic regression fits a parabola to data, useful when the relationship is not linear. The equation is .
Use calculator/statistical software to compute the quadratic regression model.
The value indicates the accuracy of the fit (closer to 1 means a better fit).
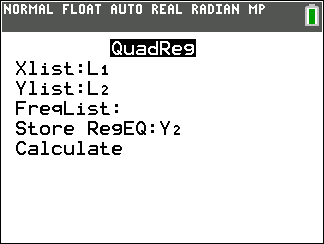
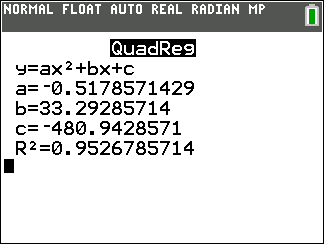
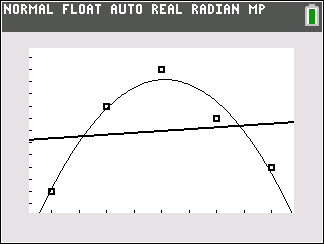
In the tire pressure/mileage example, the quadratic regression function fits the data much better than the linear regression function, as indicated by a higher value.
