 뒤로
뒤로Polynomial and Rational Functions: Properties, Graphs, and Applications 1.4
스터디 가이드 - 스마트 노트
 자료에 맞춘 맞춤형 노트, 핵심 정의, 예시, 맥락을 확장해 제공합니다.
Section 1.4: Polynomial and Rational Functions
Definition and Properties of Polynomial Functions
Polynomial functions are fundamental in business calculus, modeling a wide range of real-world phenomena. A polynomial function is an expression of the form , where the coefficients are real numbers and is a non-negative integer.
Domain: The set of all real numbers.
Range: For odd degree polynomials, all real numbers; for even degree, a proper subset of reals.
Types:
Constant function: Degree 0
Linear function: Degree 1
Quadratic function: Degree 2
Shared Properties of Odd Degree Polynomial Graphs
All odd degree polynomials cross the x-axis at least once.
With a positive leading coefficient, the graph starts negative and ends positive.
With a negative leading coefficient, the graph starts positive and ends negative.
Shared Properties of Even Degree Polynomial Graphs
Some even degree polynomials never intersect the x-axis.
With a positive leading coefficient, the graph starts and ends positive.
With a negative leading coefficient, the graph starts and ends negative.
Examples: Graphs of Polynomials
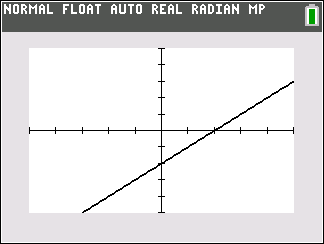
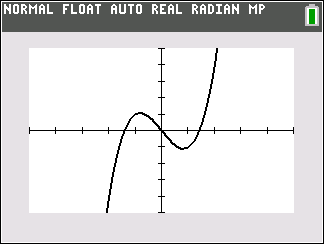
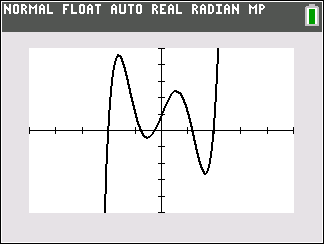
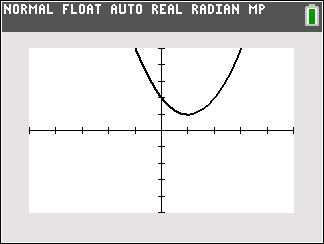
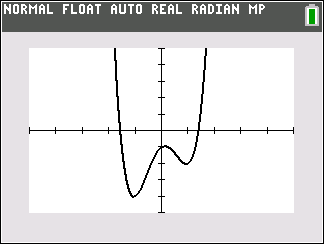
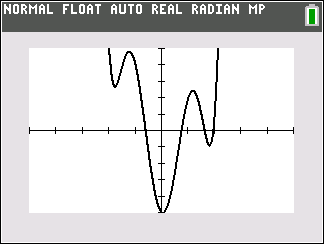
Below are examples of polynomial graphs of various degrees, illustrating their typical shapes and behaviors.
Degree 1 (Linear):
Degree 3 (Cubic):
Degree 5:
Degree 2 (Quadratic):
Degree 4:
Degree 6:
Observations About Polynomial Graphs
Odd degree polynomials with positive leading coefficients start negative and end positive; their ends move in opposite directions.
Odd degree polynomials always cross the x-axis at least once.
Even degree polynomials with positive leading coefficients start and end positive; their ends move in the same direction.
Some even degree polynomials cross the x-axis, some do not.
Other Observations
No graph crosses the x-axis more times than its degree.
Changes in direction (turning points) are limited to one less than the degree.
Continuity and Smoothness of Polynomial Functions
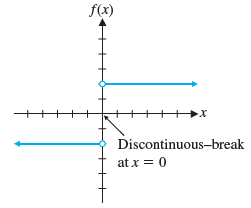
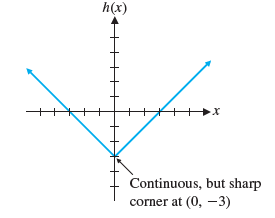
Polynomials are continuous functions, meaning their graphs can be drawn without lifting the pen. They are also smooth, lacking sharp corners.
Continuous and smooth: All polynomial graphs.
Discontinuous: Graphs with breaks (not polynomials).
Continuous but not smooth: Graphs with sharp corners (not polynomials).
Polynomial Regression
Polynomial regression is a statistical method used to model data with polynomial functions. Calculators can perform quadratic, cubic, and higher-degree regressions to find best-fit models for data sets.
Example: Cubic Regression
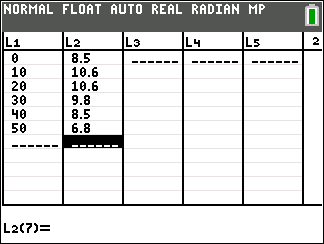
Input data into calculator statistics editor (L1 for years, L2 for marriage rate).
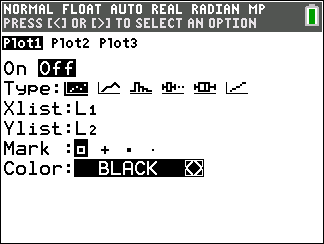
Set up scatter plot using stat plot menu.
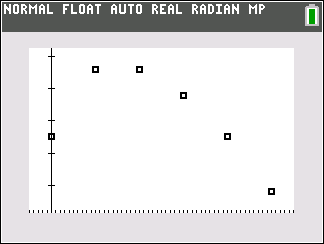
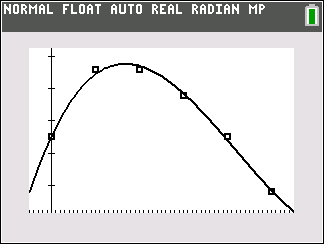
Graph the scatter plot.
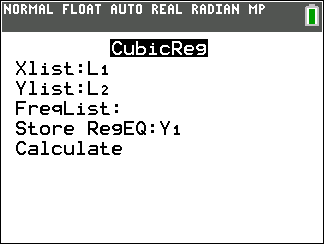
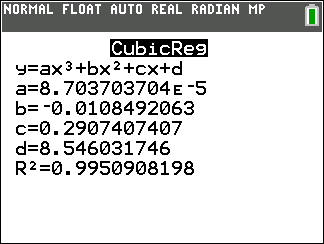
Perform cubic regression (Stat Calc menu, CubicReg option).
Result: , (accuracy of fit is 99.5%).
Graph of cubic regression function compared to scatter plot.
Definition and Properties of Rational Functions
A rational function is a quotient of two polynomial functions, , where .
The domain excludes values where .
Vertical Asymptotes
A vertical asymptote is a line that the graph approaches but does not cross, occurring where the denominator is zero and the numerator is not.
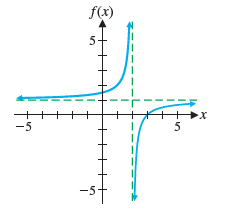
Example: has a vertical asymptote at .
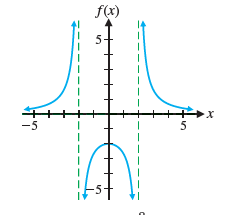
Example: has vertical asymptotes at and .
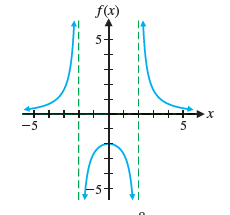
Example: has no vertical asymptotes.
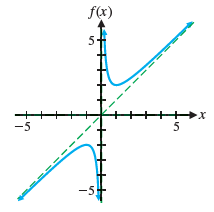
Horizontal Asymptotes
A horizontal asymptote is a line that the graph approaches as increases or decreases without bound.
Example: has a horizontal asymptote at .
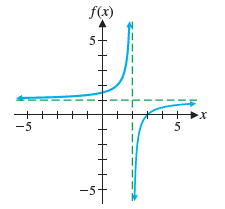
Example: has a horizontal asymptote at .
Example: has no horizontal asymptote.
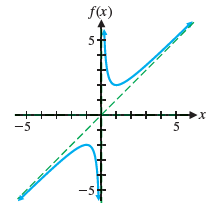
Number of Vertical Asymptotes
If the denominator has degree , the function can have at most $n$ vertical asymptotes.
If and share common real zeros, cancel common factors before determining asymptotes.
Horizontal Asymptotes: Degree Comparison
If numerator degree < denominator degree: horizontal asymptote at .
If numerator degree = denominator degree: horizontal asymptote at (leading coefficients).
If numerator degree > denominator degree: no horizontal asymptote.
Example: Finding Asymptotes
Given and , the rational function reduces by cancelling :
Vertical Asymptote: The reduced denominator has a zero at , so $x = -1$ is the only vertical asymptote.
Horizontal Asymptote: Both numerator and denominator have degree 2; leading coefficients are 3 and 2, so the horizontal asymptote is .
Bounded Functions
A function is bounded if its entire graph lies between two horizontal lines. Only constant polynomials are bounded, but many rational functions are bounded.
Applications of Rational Functions
Rational functions are used to model real-world business scenarios, such as employee productivity over time.
Example: models components assembled per day after days of training.
Vertical asymptote: None in the domain .
Horizontal asymptote: approaches 50 as increases without bound, indicating an upper productivity limit.
Example Application: As increases, approaches 50, meaning 50 components per day is the expected upper limit for an employee.
