2. Describing Data with Tables and Graphs / Bar Graphs and Pareto Charts / 문제 10
문제 10
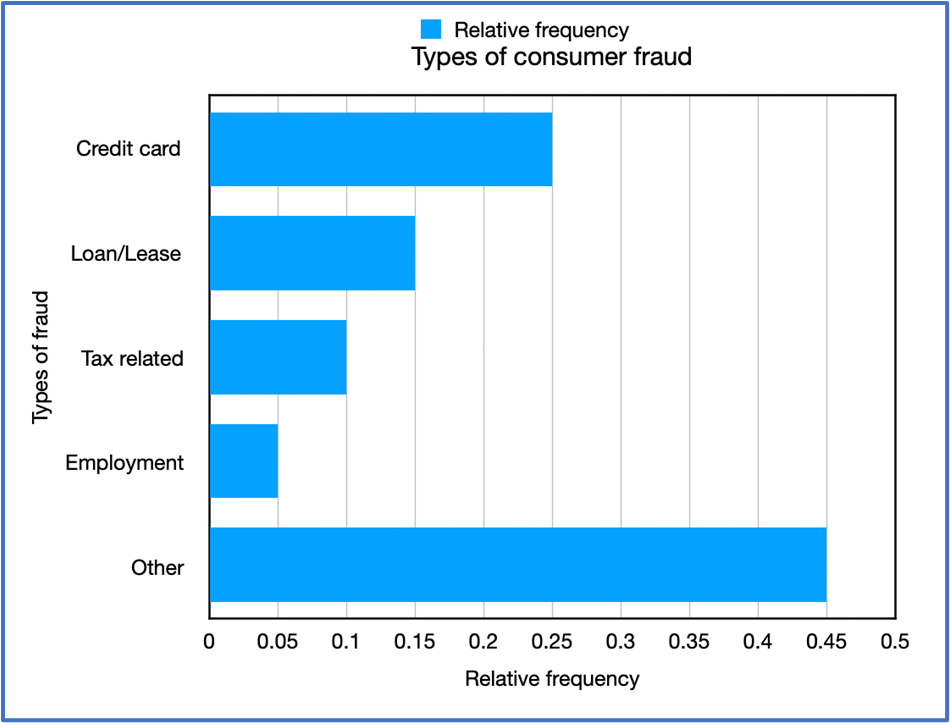
The following relative-frequency bar graph displays the types of consumer fraud reported in a survey. Approximately what percentage of fraud cases involved loan or lease fraud?