2. Describing Data with Tables and Graphs / Histograms / 문제 10
문제 10
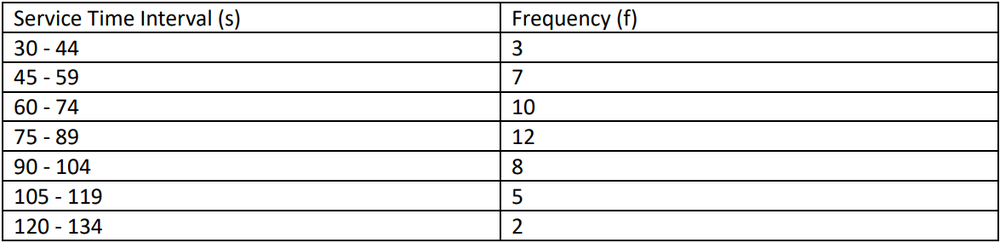
A researcher recorded the drive-thru service times (in seconds) at a local fast-food restaurant during dinner hours. Construct a histogram for yourself using the provided frequency distribution and answer the following question: Using a strict interpretation of the criteria for normality, does the histogram suggest the data follows a normal distribution?