Skip to main content
Statistics for Business
나의 코스
배우기
시험 준비
AI 튜터
학습 가이드
플래시카드
탐험해 보세요
앱을 사용해 보세요
나의 코스
배우기
시험 준비
AI 튜터
학습 가이드
플래시카드
탐험해 보세요
앱을 사용해 보세요
뒤로
5-Number Summary Using a TI-84 definitions
카드를 뒤집기 위해 탭할 수 있습니다.
Five-Number Summary
카드를 뒤집기 위해 탭할 수 있습니다.
👆
Five-Number Summary
A set of values summarizing a dataset, including minimum, first quartile, median, third quartile, and maximum.
진행 상황 추적
컨트롤 버튼이 '내비게이션' 모드로 변경되었습니다.
1/15
관련 플래시카드
관련 실천
추천 영상
5-Number Summary Using a TI-84 quiz
5-Number Summary Using a TI-84
15 용어
5-Number Summary Using a TI-84
3. Describing Data Numerically
10 문제점
주제
Boxplots
3. Describing Data Numerically
5 문제점
주제
Ernest
3. Describing Data Numerically
8 주제
19 문제점
장
Jonathan
04:51
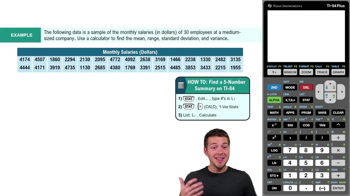
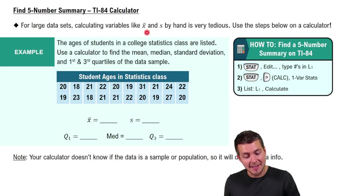
Find 5-Number Summary - TI-84 Calculator
363
views
3
rank
05:45
Find 5-Number Summary - TI-84 Calculator Example 1
190
views
2
rank
이 집합의 용어 (15)
하이드의 정의
Five-Number Summary
A set of values summarizing a dataset, including minimum, first quartile, median, third quartile, and maximum.
TI-84 Calculator
A graphing device used to input data and quickly compute statistical measures for large datasets.
Mean
The average value of a dataset, calculated by summing all entries and dividing by the number of data points.
Median
The middle value in an ordered dataset, dividing the data into two equal halves.
Standard Deviation
A measure indicating how much data values deviate from the mean, reflecting dataset variability.
First Quartile
The value below which 25% of the data falls, marking the lower quarter of the dataset.
Third Quartile
The value below which 75% of the data falls, marking the upper quarter of the dataset.
One-Variable Statistics
A calculator function that outputs key statistical measures from a single list of data.
Sample
A subset of a population, used to estimate characteristics of the whole group.
Population
The entire group from which data can be collected or analyzed.
SX
The symbol representing sample standard deviation on the TI-84, used for sample data analysis.
Sigma X
The symbol representing population standard deviation on the TI-84, used for population data analysis.
Minimum
The smallest value in a dataset, indicating the lower boundary of the data range.
Maximum
The largest value in a dataset, indicating the upper boundary of the data range.
Data List
An organized sequence of values entered into the calculator for statistical analysis.
 뒤로뒤로
뒤로뒤로

 04:51
04:51