Skip to main content
Statistics for Business
나의 코스
배우기
시험 준비
AI 튜터
학습 가이드
플래시카드
탐험해 보세요
앱을 사용해 보세요
나의 코스
배우기
시험 준비
AI 튜터
학습 가이드
플래시카드
탐험해 보세요
앱을 사용해 보세요
뒤로
Frequency Polygons definitions
카드를 뒤집기 위해 탭할 수 있습니다.
Frequency Polygon
카드를 뒤집기 위해 탭할 수 있습니다.
👆
Frequency Polygon
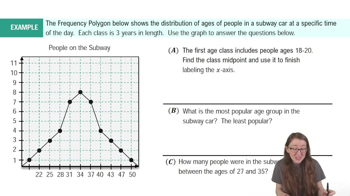
A graph using points connected by segments to display frequencies across classes, offering an alternative to histograms.
진행 상황 추적
컨트롤 버튼이 '내비게이션' 모드로 변경되었습니다.
1/14
관련 플래시카드
관련 실천
추천 영상
Frequency Polygons quiz
Frequency Polygons
15 용어
Frequency Polygons
2. Describing Data with Tables and Graphs
10 문제점
주제
Dot Plots
2. Describing Data with Tables and Graphs
10 문제점
주제
Ally
2. Describing Data with Tables and Graphs
10 주제
15 문제점
장
David-Paige
VideoThumbView.guidedCourse
04:41
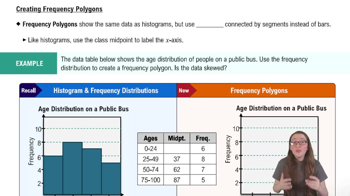
Creating Frequency Polygons
394
views
6
rank
VideoThumbView.guidedCourse
04:15
Example 1
281
views
13
rank
이 집합의 용어 (14)
하이드의 정의
Frequency Polygon
A graph using points connected by segments to display frequencies across classes, offering an alternative to histograms.
Histogram
A bar graph representing frequencies for class intervals, with bar heights showing the frequency of each class.
Frequency Distribution
A summary table showing how data values are distributed across different classes or intervals.
Class Midpoint
A value found by averaging the lower and upper limits of a class, used as the x-coordinate for plotting.
Class Interval
A range of values grouped together in a frequency distribution, often defined by lower and upper limits.
Lower Limit
The smallest value included in a class interval, marking its starting boundary.
Upper Limit
The largest value included in a class interval, marking its ending boundary.
Y-Axis
The vertical axis on a graph, representing frequencies in both histograms and frequency polygons.
X-Axis
The horizontal axis on a graph, labeled with class midpoints for frequency polygons and histograms.
Skew
A measure of asymmetry in a distribution, identified by the direction and length of the tails relative to the peak.
Peak
The highest point on a frequency polygon or histogram, indicating the class with the greatest frequency.
Tail
The extended part of a distribution on either side of the peak, used to assess skewness.
Segment
A straight line connecting two plotted points on a frequency polygon, forming its shape.
Line Graph
A graph connecting data points to show trends over time, often confused with frequency polygons but used differently.
 뒤로뒤로
뒤로뒤로

 04:41
04:41