Skip to main content
Statistics for Business
나의 코스
배우기
시험 준비
AI 튜터
학습 가이드
플래시카드
탐험해 보세요
앱을 사용해 보세요
나의 코스
배우기
시험 준비
AI 튜터
학습 가이드
플래시카드
탐험해 보세요
앱을 사용해 보세요
뒤로
Frequency Polygons quiz
카드를 뒤집기 위해 탭할 수 있습니다.
What is a frequency polygon?
카드를 뒤집기 위해 탭할 수 있습니다.
👆
What is a frequency polygon?
A frequency polygon is a graph that displays frequency distributions using points connected by segments instead of bars.
진행 상황 추적
컨트롤 버튼이 '내비게이션' 모드로 변경되었습니다.
1/15
관련 플래시카드
관련 실천
추천 영상
Frequency Polygons definitions
Frequency Polygons
14 용어
Frequency Polygons
2. Describing Data with Tables and Graphs
10 문제점
주제
Dot Plots
2. Describing Data with Tables and Graphs
10 문제점
주제
Ally
2. Describing Data with Tables and Graphs
10 주제
15 문제점
장
David-Paige
VideoThumbView.guidedCourse
04:41
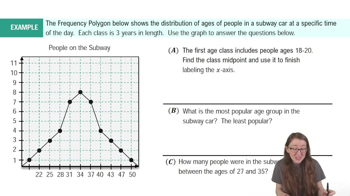
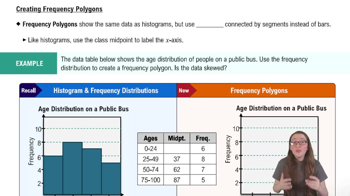
Creating Frequency Polygons
394
views
6
rank
VideoThumbView.guidedCourse
04:15
Example 1
281
views
13
rank
이 집합의 용어 (15)
하이드의 정의
What is a frequency polygon?
A frequency polygon is a graph that displays frequency distributions using points connected by segments instead of bars.
How does a frequency polygon differ from a histogram?
A frequency polygon uses points connected by lines, while a histogram uses bars to represent frequencies.
What does the y-axis represent in a frequency polygon?
The y-axis represents the frequencies of the classes.
What does the x-axis represent in a frequency polygon?
The x-axis shows the class midpoints, which are calculated as the average of the lower and upper class limits.
How do you calculate a class midpoint?
Add the lower and upper limits of a class and divide by two.
What is the first step in creating a frequency polygon?
Plot points at each class midpoint according to their frequencies.
How do you connect the points in a frequency polygon?
Connect the plotted points with straight line segments.
How are the axes labeled in a frequency polygon compared to a histogram?
Both the x and y axes are labeled the same way as in a histogram, with frequencies on the y-axis and class midpoints on the x-axis.
What does a point on a frequency polygon represent?
A point represents the frequency of a class at its midpoint.
How do you interpret the x and y coordinates of a point in a frequency polygon?
The x coordinate is the class midpoint, and the y coordinate is the frequency for that class.
How do you determine skew in a frequency polygon?
Look for the peak and check the tails; left tail indicates left skew, right tail indicates right skew, and equal tails mean no skew.
What is the formula for finding a class midpoint?
Class midpoint = (lower limit + upper limit) / 2.
Can frequency polygons be confused with line graphs?
Yes, but frequency polygons show frequencies for classes, not exact values at each point.
What does it mean if a frequency polygon has no tail extending further to the left or right?
It means the data is not skewed.
Why might you use a frequency polygon instead of a histogram?
A frequency polygon can make it easier to compare multiple distributions and visualize trends.
 뒤로뒤로
뒤로뒤로

 04:41
04:41