Skip to main content
Statistics for Business
나의 코스
배우기
시험 준비
AI 튜터
학습 가이드
플래시카드
탐험해 보세요
앱을 사용해 보세요
나의 코스
배우기
시험 준비
AI 튜터
학습 가이드
플래시카드
탐험해 보세요
앱을 사용해 보세요
뒤로
Standard Normal Distribution definitions
카드를 뒤집기 위해 탭할 수 있습니다.
Standard Normal Distribution
카드를 뒤집기 위해 탭할 수 있습니다.
👆
Standard Normal Distribution
A symmetric, bell-shaped curve with a mean of zero and a standard deviation of one, used as a reference for probability calculations.
진행 상황 추적
컨트롤 버튼이 '내비게이션' 모드로 변경되었습니다.
1/15
관련 플래시카드
관련 실천
추천 영상
Standard Normal Distribution quiz
Standard Normal Distribution
15 용어
Standard Normal Distribution
6. Normal Distribution & Continuous Random Variables
10 문제점
주제
Ernest
Probabilities & Z-Scores w/ Graphing Calculator
6. Normal Distribution & Continuous Random Variables
10 문제점
주제
Jonathan
6. Normal Distribution & Continuous Random Variables
4 주제
15 문제점
장
Ernest
VideoThumbView.guidedCourse
03:50
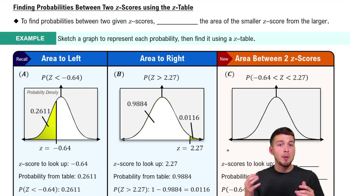
Probabilities Between Two Values
428
views
14
rank
VideoThumbView.guidedCourse
09:47
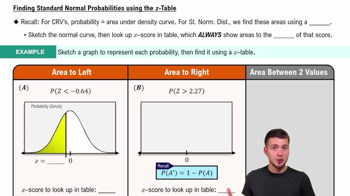
Finding Standard Normal Probabilities using z-Table
843
views
17
rank
VideoThumbView.guidedCourse
08:50
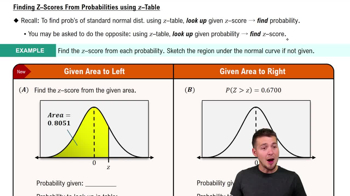
Z-Scores from Probabilities
453
views
6
rank
이 집합의 용어 (15)
하이드의 정의
Standard Normal Distribution
A symmetric, bell-shaped curve with a mean of zero and a standard deviation of one, used as a reference for probability calculations.
Z-Score
A value representing the number of standard deviations a data point is from the mean on the standard normal curve.
Z-Table
A chart listing cumulative probabilities for z-scores, allowing quick lookup of areas under the standard normal curve.
Cumulative Probability
The total area under the curve to the left of a specific z-score, representing the probability up to that point.
Complement
The probability of the area to the right of a z-score, found by subtracting the left area from one.
Continuous Random Variable
A variable that can take any value within a range, with probabilities represented by areas under a curve.
Density Curve
A graphical representation where the area under the curve corresponds to probability for a continuous variable.
Area to the Left
The region under the standard normal curve from negative infinity up to a given z-score, matching cumulative probability.
Area to the Right
The region under the standard normal curve from a given z-score to positive infinity, found using the complement.
Mean
The central value of the standard normal distribution, always located at zero on the horizontal axis.
Standard Deviation
The measure of spread in the standard normal distribution, with each z-score unit representing one increment.
Probability
The likelihood of a value or range occurring, represented by the area under the standard normal curve.
Hypothesis Testing
A statistical method using the standard normal distribution to assess evidence against a claim.
Interval
A range between two z-scores, with its probability found by subtracting the smaller cumulative area from the larger.
Hundredths Place
The second decimal position in a z-score, used to precisely locate values in the z-table.
 뒤로뒤로
뒤로뒤로

 03:50
03:50