Skip to main content
Statistics for Business
나의 코스
배우기
시험 준비
AI 튜터
학습 가이드
플래시카드
탐험해 보세요
앱을 사용해 보세요
나의 코스
배우기
시험 준비
AI 튜터
학습 가이드
플래시카드
탐험해 보세요
앱을 사용해 보세요
뒤로
Standard Normal Distribution quiz
카드를 뒤집기 위해 탭할 수 있습니다.
What does a z-score represent in the standard normal distribution?
카드를 뒤집기 위해 탭할 수 있습니다.
👆
What does a z-score represent in the standard normal distribution?
A z-score measures how many standard deviations a value is from the mean in the standard normal distribution.
진행 상황 추적
컨트롤 버튼이 '내비게이션' 모드로 변경되었습니다.
1/15
관련 플래시카드
관련 실천
추천 영상
Standard Normal Distribution definitions
Standard Normal Distribution
15 용어
Standard Normal Distribution
6. Normal Distribution & Continuous Random Variables
10 문제점
주제
Ernest
Probabilities & Z-Scores w/ Graphing Calculator
6. Normal Distribution & Continuous Random Variables
10 문제점
주제
Jonathan
6. Normal Distribution & Continuous Random Variables
4 주제
15 문제점
장
Ernest
VideoThumbView.guidedCourse
03:50
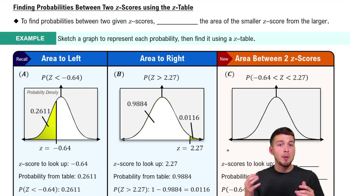
Probabilities Between Two Values
428
views
14
rank
VideoThumbView.guidedCourse
09:47
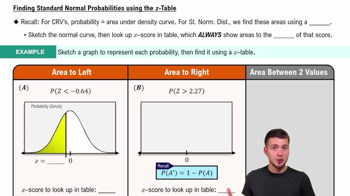
Finding Standard Normal Probabilities using z-Table
843
views
17
rank
VideoThumbView.guidedCourse
08:50
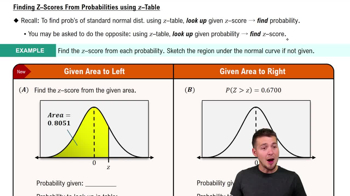
Z-Scores from Probabilities
453
views
6
rank
이 집합의 용어 (15)
하이드의 정의
What does a z-score represent in the standard normal distribution?
A z-score measures how many standard deviations a value is from the mean in the standard normal distribution.
How do you find the probability that z is less than a given value using a z-table?
Look up the given z-score in the z-table; the value you find is the probability that z is less than that value.
What does the area under the standard normal curve represent?
The area under the curve represents probability, with the total area equal to 1.
What is the first step you should take when solving a standard normal probability problem?
You should draw a sketch of the normal curve and shade the area corresponding to the probability you are finding.
How are the values in a z-table organized?
The rows represent the tenths place of the z-score, and the columns represent the hundredths place.
If you are asked to find the probability that z is greater than a given value, what should you do with the z-table value?
Subtract the z-table value from 1 to get the probability to the right of the given z-score.
What does the z-table value always represent by default?
It always represents the cumulative probability (area) to the left of the given z-score.
How do you find the probability that z is between two values using the z-table?
Subtract the smaller cumulative area (from the lower z-score) from the larger cumulative area (from the higher z-score).
What is the probability that z is less than -0.64, given the z-table value is 0.2611?
The probability is 0.2611, as read directly from the z-table.
If the z-table value for z = 2.27 is 0.9884, what is the probability that z is greater than 2.27?
The probability is 1 - 0.9884 = 0.0116.
How do you find a z-score given a cumulative probability (area to the left)?
Look up the given probability in the z-table and find the corresponding z-score.
If you are given an area to the right of a z-score, what must you do before using the z-table?
Subtract the given area from 1 to find the area to the left, then use the z-table.
What is the z-score corresponding to a cumulative probability of 0.8051?
The z-score is 0.86.
If the area to the right of a z-score is 0.67, what is the z-score?
First, find the area to the left (1 - 0.67 = 0.33), then look up 0.33 in the z-table to get z = -0.44.
Why is it important to draw a graph when solving standard normal distribution problems?
Drawing a graph helps you visualize the area you are finding and reduces the chance of making mistakes.
 뒤로뒤로
뒤로뒤로

 03:50
03:50