 뒤로
뒤로Chapter 1: Statistics, Data, and Statistical Thinking – Study Notes
스터디 가이드 - 스마트 노트
 자료에 맞춘 맞춤형 노트, 핵심 정의, 예시, 맥락을 확장해 제공합니다.
Statistics, Data, and Statistical Thinking
The Science of Statistics
Statistics is the science of collecting, classifying, summarizing, organizing, analyzing, and interpreting numerical information. It is foundational for making informed decisions in business and economics.
Collecting Data: Gathering information through surveys, experiments, or observation.
Characterizing Data: Using measures such as mean and median to describe data sets.
Analyzing Data: Identifying trends and patterns within the data.
Interpreting Data: Drawing conclusions and making decisions based on data analysis.
Types of Statistical Applications in Business
Statistics in business involves two main processes: describing data and drawing conclusions about data sets based on sampling.
Descriptive Statistics: Utilizes numerical and graphical methods to explore and summarize data, presenting information in a convenient form.
Inferential Statistics: Uses sample data to make estimates, decisions, predictions, or generalizations about a larger population.
Fundamental Elements of Statistics
Understanding the basic elements of statistics is essential for proper data analysis and inference.
Experimental (or Observational) Unit: The object upon which data is collected.
Population: The complete set of units of interest.
Variable: A property or characteristic measured on each unit.
Sample: A subset of the population.
Statistical Inference: Making predictions or generalizations about a population based on sample data.
Measure of Reliability: A statement about the degree of uncertainty associated with a statistical inference.
Example: In a survey of FOX viewers, the population is all FOX viewers, the variable is age, the sample is 200 selected viewers, and the inference is estimating the average age of all FOX viewers based on the sample.
Processes in Statistics
A process is a series of actions or operations that transforms inputs into outputs over time. In statistics, processes are often treated as 'black boxes' when internal operations are unknown.
Inputs: Information, methods, energy, materials, machines, people.
Outputs: The results or products generated by the process.
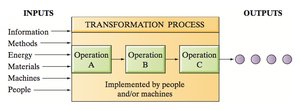
Example: Measuring customer waiting times at a drive-through window to estimate average service time.
Types of Data
Data can be classified as quantitative or qualitative, which determines the appropriate statistical methods for analysis.
Quantitative Data: Measurements recorded on a numerical scale (e.g., temperature, unemployment rate, test scores).
Qualitative Data: Measurements classified into categories (e.g., political party, car size, species).
Example: In a study of fish, length, weight, and DDT concentration are quantitative variables, while river/creek and species are qualitative variables.
Collecting Data: Sampling and Related Issues
Data can be obtained from various sources and through different methods, each with implications for the reliability of statistical inferences.
Published Source: Data from books, journals, newspapers, or websites.
Designed Experiment: Researcher controls the characteristics of experimental units.
Survey: Collecting responses from a group of people.
Observational Study: Observing units in their natural setting without intervention.
Sampling Methods:
Simple Random Sample: Every possible sample of size n has an equal chance of selection.
Stratified Random Sample: Population divided into groups (strata), and samples are drawn from each group.
Cluster Sample: Natural groupings are sampled, and all units within selected clusters are studied.
Systematic Sample: Every kth unit is selected from a list.
Randomized Response Sample: Used for sensitive questions to reduce bias.
Sampling Errors:
Selection Bias: Some units have no chance of being selected.
Nonresponse Bias: Data cannot be obtained from all selected units.
Measurement Error: Inaccuracies in recorded data due to ambiguous questions or respondent effects.
Business Analytics: Critical Thinking with Statistics
Business analytics uses statistical methods to extract useful information from data for better decision-making. Statistical thinking involves applying rational thought and recognizing that variation exists in all data.
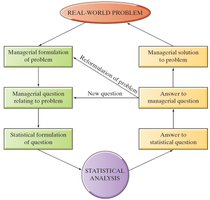
Descriptive Applications: Identify population/sample, variables, collect and describe data.
Inferential Applications: Identify population, variables, collect sample data, make inferences, and measure reliability.
Summary Table: Types of Data and Sampling Methods
Type | Description | Example |
|---|---|---|
Quantitative Data | Numerical measurements | Test scores, temperature |
Qualitative Data | Categorical measurements | Political party, car size |
Simple Random Sample | Equal chance for all samples | Randomly selected households |
Stratified Sample | Samples from each group | Sampling by age group |
Cluster Sample | All units in selected clusters | Sampling by city blocks |
Systematic Sample | Every kth unit selected | Every 10th customer |
Key Concepts and Applications
Statistics is essential for business decision-making and quantitative literacy.
Understanding the difference between descriptive and inferential statistics is crucial for proper data analysis.
Proper sampling methods and awareness of potential biases ensure the reliability of statistical inferences.
