 뒤로
뒤로Database Analytics and Data Management for Business Statistics
스터디 가이드 - 스마트 노트
 자료에 맞춘 맞춤형 노트, 핵심 정의, 예시, 맥락을 확장해 제공합니다.
Database Analytics in Business Statistics
Data Sets and Databases
Understanding the structure and management of data is foundational for business statistics. A data set is a collection of related data, such as survey responses or sales records. A database is a structured collection of related files, typically organized in tables where fields (columns) represent attributes and records (rows) represent individual data entries.
Fields/Attributes: Individual pieces of data (e.g., Product Name, Quantity).
Records: Complete sets of related data (e.g., a single purchase order).
Tables: Two-dimensional arrangements of data, facilitating organization and analysis.

Example: A purchase order database where each row is a record and each column is a field.
Range Names and Table References in Excel
Excel allows users to assign range names to rows and columns, making calculations more intuitive. For example, naming a column 'Product_A' enables the formula =SUM(Product_A) to compute total sales for that product.
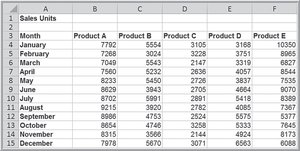
Example: Assigning range names to monthly sales data for easier aggregation.
Excel Tables and Table-Based Calculations
Excel tables enhance data management by allowing structured references and automatic updates when new data is added. Calculations such as =SUM(Table1[Savings]) or =COUNTIF(Table1[Housing], "Own") are dynamic and update with the table.
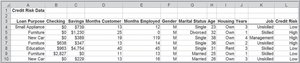
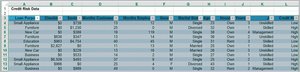
Example: Summing savings or counting homeowners in a credit risk data table.
Data Queries: Sorting, Filtering, and Analysis
Sorting Data
Sorting arranges data in a specified order, such as alphabetically by supplier or numerically by cost. This is essential for identifying trends and preparing data for further analysis.
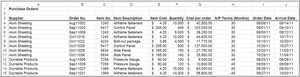
Example: Sorting purchase orders by supplier to facilitate analysis.
Pareto Analysis (80-20 Rule)
The Pareto Principle states that a large proportion of effects come from a small proportion of causes (e.g., 80% of sales from 20% of customers). Pareto analysis involves sorting data, calculating cumulative proportions, and identifying key contributors.
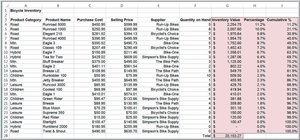
Example: Calculating inventory value, percentage, and cumulative percentage for products to identify top contributors.
Filtering Data
Filtering extracts subsets of data that meet specific criteria. Excel provides AutoFilter for simple filters and Advanced Filter for complex, multi-criteria queries.
AutoFilter: Quick filtering by value or condition.
Advanced Filter: Allows AND/OR logic and custom criteria ranges.
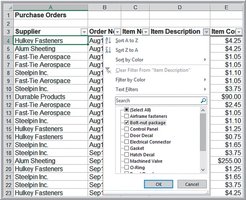
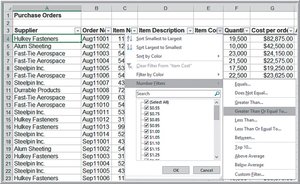
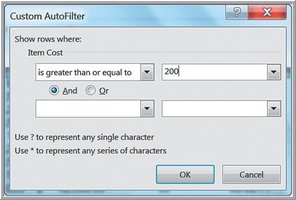
Example: Filtering purchase orders for a specific item or for costs above a threshold.
Database Functions in Excel
Database functions such as DSUM, DAVERAGE, and DCOUNT perform calculations on filtered subsets of data. The syntax is DSUM(database, field, criteria), where criteria specifies which records to include.

Example: Calculating the total cost of orders that meet specific criteria using DSUM.
Logical and Lookup Functions
Logical Functions: IF and Nested IF
The IF function returns values based on logical tests. Nested IFs allow for multiple conditions. For example, classifying orders as 'Large' or 'Critical' based on quantity and cost.
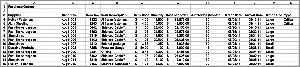
Example: =IF(Quantity >= 10000, "Large", "Small")
Lookup Functions: VLOOKUP, HLOOKUP, INDEX, MATCH, CHOOSE
Lookup functions retrieve data from tables based on specified criteria:
VLOOKUP: Looks up a value in the leftmost column and returns a value from a specified column.
HLOOKUP: Looks up a value in the top row and returns a value from a specified row.
INDEX: Returns the value at a specified row and column in a range.
MATCH: Returns the position of a value in a range.
CHOOSE: Returns a value from a list based on an index number.
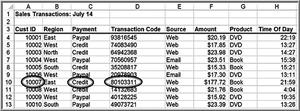
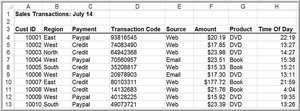
Example: Using VLOOKUP to find payment type or transaction code in a sales database.
Combining INDEX and MATCH
Combining INDEX and MATCH allows for flexible lookups, such as retrieving sales for a given month and product.
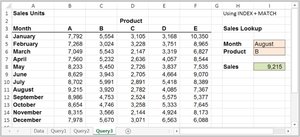
Example: =INDEX(A4:F15, MATCH(Month, A4:A15, 0), MATCH(Product, A3:F3, 0))
Data Validation and Form Controls
Data Validation
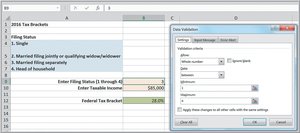
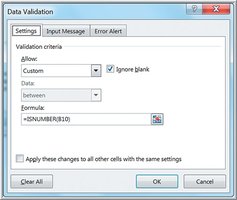
Data validation restricts the type of data entered into a cell, ensuring data integrity. For example, requiring a whole number between 1 and 4 for filing status, or using =ISNUMBER(B10) to ensure numeric input.
Form Controls
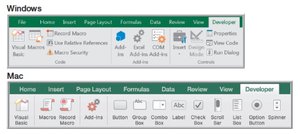
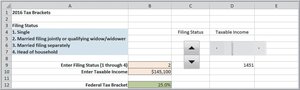
Form controls such as spin buttons, scroll bars, and combo boxes enhance user interaction with spreadsheets, making data entry and selection more user-friendly.
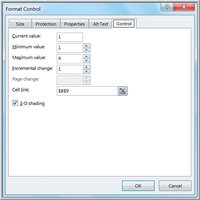
PivotTables for Data Exploration
Creating and Customizing PivotTables
PivotTables are powerful tools for summarizing, analyzing, and visualizing large data sets. They allow users to create cross-tabulations, aggregate data, and drill down into details.
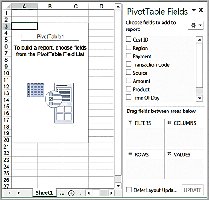
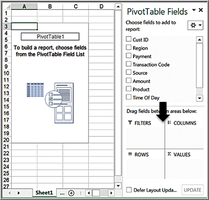
PivotTable Examples
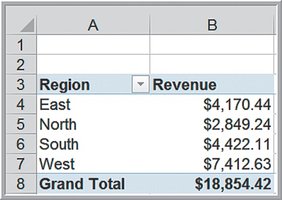
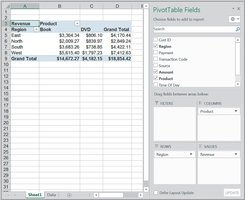
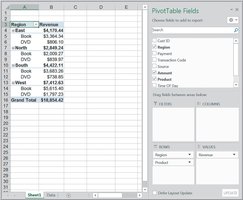
PivotTables can display total revenue by region, breakdowns by product, and alternate views for deeper analysis.
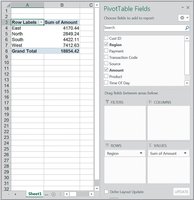
PivotTable Customization and Advanced Features
PivotTables can be customized to show counts, percentages, and filtered views. Slicers provide interactive filtering for deeper insights.
Value Field Settings: Change aggregation (sum, count, average, etc.).
Show Values As: Display values as percentages of totals.
Report Filters and Slicers: Add dimensions and interactive filtering.
Summary Table: Key Excel Functions for Business Statistics
Function | Purpose | Example |
|---|---|---|
SUM | Adds values | =SUM(Product_A) |
COUNTIF | Counts values meeting criteria | =COUNTIF(Table1[Housing], "Own") |
DSUM | Sums values meeting criteria | =DSUM(database, "Cost", criteria) |
IF | Conditional logic | =IF(Quantity>=10000, "Large", "Small") |
VLOOKUP | Vertical lookup in table | =VLOOKUP(value, table, col, FALSE) |
INDEX+MATCH | Flexible lookup | =INDEX(range, MATCH(row), MATCH(col)) |
ISNUMBER | Checks if value is numeric | =ISNUMBER(B10) |
Additional info: These tools and techniques are foundational for organizing, querying, and analyzing business data, which is essential for descriptive statistics, data visualization, and data-driven decision making in business contexts.
