 뒤로
뒤로Descriptive Statistics: Measures of Central Tendency and Variability
스터디 가이드 - 스마트 노트
 자료에 맞춘 맞춤형 노트, 핵심 정의, 예시, 맥락을 확장해 제공합니다.
Calculating Descriptive Statistics
Measures of Central Tendency
Measures of central tendency are statistical values that describe the center or typical value of a dataset. The three most common measures are the mean, median, and mode. Each measure provides a different perspective on the data's central location.
Mean
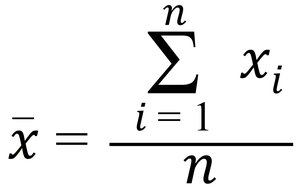
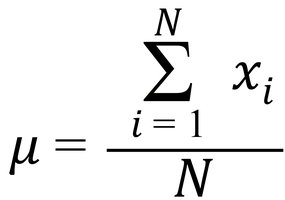
Definition: The mean, or average, is calculated by summing all values in a dataset and dividing by the number of observations.
Sample Mean Formula:



Population Mean Formula:
Example: For the sample values , the sample mean is:

Weighted Mean
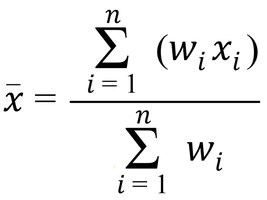
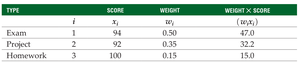
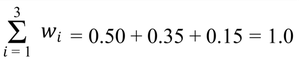
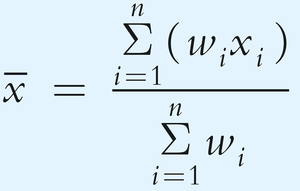
The weighted mean assigns different weights to values, reflecting their relative importance.
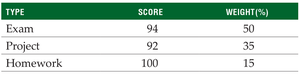
Example: Suppose your statistics grade is based on an exam, project, and homework with different weights.


Advantages and Disadvantages of the Mean
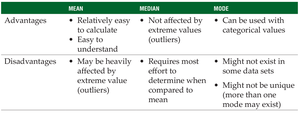
Advantages: Simple to calculate and widely understood.
Disadvantages: Sensitive to outliers and may not represent the data well if the distribution is skewed.
Median
Definition: The median is the middle value when data are arranged in ascending order. If the number of observations is even, it is the average of the two middle values.
Index Point Formula: , where is the number of data points. If is not a whole number, round up.
Example: For , the median is the 5th value in the sorted list.
Robustness: The median is not sensitive to outliers.
Mode
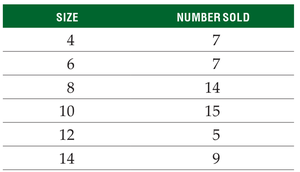
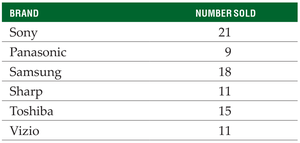
Definition: The mode is the value that appears most frequently in a dataset. There can be more than one mode or none at all.
Example (Numerical Data):
Example (Categorical Data):
Shapes of Frequency Distributions
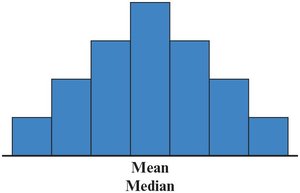
Symmetric: Mean = Median
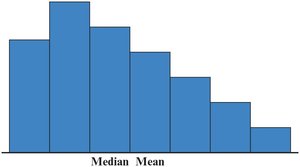
Right-Skewed: Median < Mean
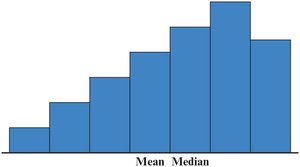
Left-Skewed: Mean < Median
Using Excel for Central Tendency
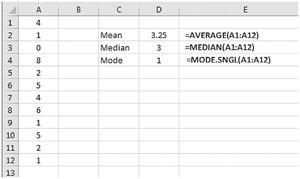
Excel functions: AVERAGE, MEDIAN, MODE.SNGL
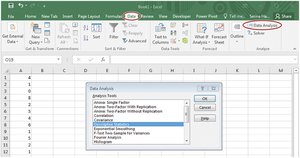
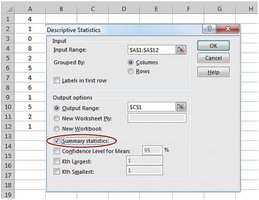
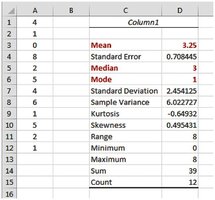
Excel's Data Analysis tool can also be used for descriptive statistics.
Choosing the Appropriate Measure
Use the mean for symmetric distributions without outliers.
Use the median for skewed distributions or when outliers are present.
Use the mode for categorical data.
Measures of Variability
Measures of variability describe the spread or dispersion of data values. Common measures include the range, variance, and standard deviation.
Range
Definition: The range is the difference between the highest and lowest values in a dataset.
Formula: Range = Highest value – Lowest value
Variance and Standard Deviation
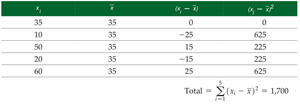
Sample Variance Formula:
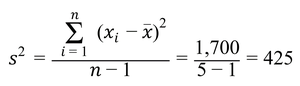
Sample Standard Deviation Formula:

Population Variance Formula:




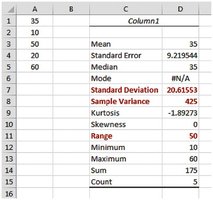
Using Excel for Variability
Excel functions: VAR.S, STDEV.S for samples; VAR.P, STDEV.P for populations.
Using the Mean and Standard Deviation Together
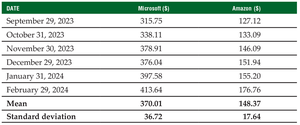
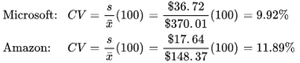
The standard deviation is often used to measure consistency in business applications. However, when comparing datasets with different means, the coefficient of variation (CV) is more appropriate.
Coefficient of Variation Formula (Sample):
Coefficient of Variation Formula (Population):
z-Score
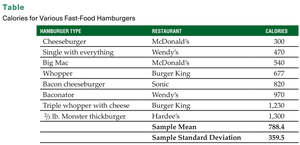
The z-score indicates how many standard deviations a value is from the mean. It is used to identify outliers and compare values from different distributions.
Sample z-Score Formula:
Population z-Score Formula:

The Empirical Rule
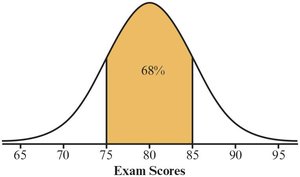
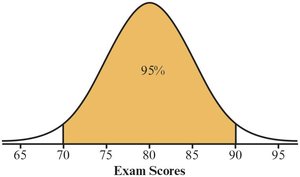
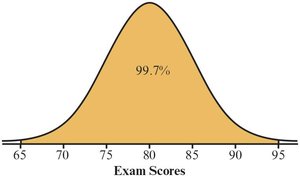
The empirical rule applies to bell-shaped (normal) distributions:
Approximately 68% of values fall within ±1 standard deviation of the mean.
Approximately 95% within ±2 standard deviations.
Approximately 99.7% within ±3 standard deviations.
Grouped Data
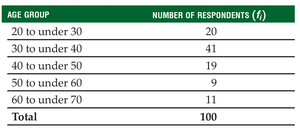
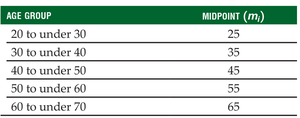
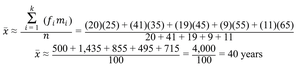
When data are grouped into classes, the mean and variance can be estimated using class midpoints and frequencies.
Sample Mean from Grouped Data:
Measures of Relative Position
These measures compare the position of a value relative to the rest of the data. Common measures include percentiles, quartiles, and z-scores.
Percentiles
The pth percentile is the value below which p% of the data fall.
To find the percentile rank of a value, use the formula:
Quartiles
Q1: 25th percentile
Q2: 50th percentile (median)
Q3: 75th percentile
Interquartile Range (IQR)
IQR = Q3 – Q1; describes the spread of the middle 50% of data.
Box-and-Whisker Plots
Graphically display the five-number summary: minimum, Q1, median, Q3, maximum.
Outliers are plotted as individual points.
Measures of Association Between Two Variables
These statistics describe the relationship between two variables.
Sample Covariance: Measures the direction of the linear relationship.
Sample Correlation Coefficient (r): Measures both the strength and direction of the linear relationship. Values range from -1 (perfect negative) to +1 (perfect positive).
*Additional info: This summary covers all major concepts, formulas, and examples from the provided materials, with relevant images included to reinforce key points.*
