 뒤로
뒤로Introduction to Business Analytics: Foundations and Applications
스터디 가이드 - 스마트 노트
 자료에 맞춘 맞춤형 노트, 핵심 정의, 예시, 맥락을 확장해 제공합니다.
Introduction to Business Analytics
What is Business Analytics?
Business analytics is the systematic use of data, information technology, statistical analysis, quantitative methods, and mathematical or computer-based models to help managers gain improved insight about their business operations and make better, fact-based decisions.
Data: Raw numbers or textual information collected through measurement.
Information Technology: Tools and systems for storing, processing, and analyzing data.
Statistical Analysis: Methods for summarizing and interpreting data.
Quantitative Methods: Mathematical and statistical techniques for analyzing data.
Models: Abstractions or representations of real systems, ideas, or objects.
Applications of Business Analytics
Business analytics is applied across various domains to improve decision-making and operational efficiency.
Pricing: Setting optimal prices for goods and services.
Customer Segmentation: Identifying and targeting key customer groups.
Merchandising: Deciding which brands and quantities to stock.
Location: Determining optimal locations for facilities or services.
Supply Chain Design: Optimizing sourcing, transportation, and delivery routes.
Staffing: Ensuring appropriate staffing levels and hiring the right people.
Health Care: Scheduling, improving patient flow, and predicting health risks.
Impacts of Analytics
Benefits: Reduced costs, better risk management, faster decisions, improved productivity, and enhanced profitability and customer satisfaction.
Challenges: Lack of understanding, competing priorities, insufficient skills, data quality issues, and unclear cost-benefit analysis.
Evolution and Foundations of Business Analytics
Analytic Foundations
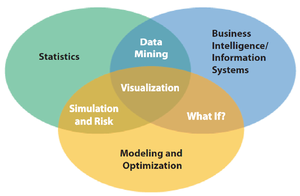
Business analytics has evolved from several foundational disciplines:
Business Intelligence (BI)
Information Systems (IS)
Statistics
Operations Research/Management Science (OR/MS)
Modern Business Analytics
Data Mining: Discovering patterns in large datasets.
Simulation and Risk Analysis: Modeling uncertainty and evaluating risks.
Decision Support Systems (DSS): Tools to aid complex decision-making.
Visualization: Graphical representation of data for insight.
Types of Analytics
Descriptive, Predictive, and Prescriptive Analytics
Descriptive Analytics: Understanding past and current performance using data.
Predictive Analytics: Forecasting future outcomes based on historical data.
Prescriptive Analytics: Identifying the best course of action to achieve objectives.
Example: Retail Markdown Decisions
Descriptive: Analyze past sales data for similar products.
Predictive: Forecast sales based on price changes.
Prescriptive: Determine optimal pricing and advertising to maximize revenue.
Data for Business Analytics
Data and Information
Data: Collected numbers or text from measurement processes.
Information: Meaning extracted from data to support decisions.
Examples of Data Sources
Annual reports, audits, profitability analysis, economic trends, marketing research, operations performance, HR measurements, web behavior analytics.
Big Data
Big data is characterized by high volume, variety, velocity, and veracity (uncertainty). Effective use of big data can transform business productivity and competitiveness.
Data Reliability and Validity
Reliability: Consistency and accuracy of data.
Validity: Data measures what it is intended to measure.
Examples:
A tire gauge that consistently reads low is not reliable, but valid for measuring pressure.
Counting customer service calls is reliable, but may not be valid for measuring dissatisfaction.
Survey questions may lack reliability and validity if they do not capture the intended concept.
Models in Business Analytics
What is a Model?
A model is an abstraction or representation of a real system, idea, or object. Models capture essential features and can be verbal, visual, mathematical, or implemented in spreadsheets.
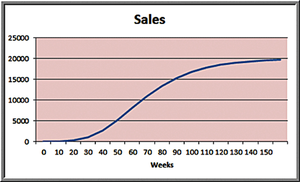
Example: Three Forms of a Model
Verbal: Describes the pattern of sales over time for a new product.
Visual: S-shaped curve showing sales growth and saturation.
Mathematical: Equation relating sales to time and other factors.
Decision Models
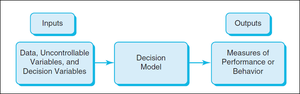
Decision models are logical or mathematical representations of business problems used to analyze and facilitate decision-making. They include:
Inputs: Data, uncontrollable variables, and decision variables.
Outputs: Measures of performance or behavior.
Descriptive Models
Descriptive models explain behavior and allow users to evaluate decisions by asking "what-if" questions.
Example: Gasoline Usage Model
Total miles driven per month:
Gallons consumed per month:
Where = miles per day, = driving days, = additional miles, = fuel economy.
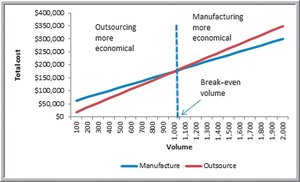
Example: Outsourcing Decision Model
Production cost:
Outsourcing cost:
Breakeven point: units
If , outsourcing is cheaper.
Predictive Models
Predictive models estimate future outcomes based on historical data.
Example: Sales-Promotion Decision Model
Model:
Application: Estimate sales for different pricing, coupon, and advertising strategies.
Prescriptive Models
Prescriptive models help identify the best solution to a decision problem, often using optimization techniques.
Objective Function: The equation to be minimized or maximized (e.g., cost or profit).
Optimal Solution: The values of decision variables that achieve the best outcome.
Example: Prescriptive Pricing Model
Sales model:
Total Revenue:
Goal: Find the price that maximizes total revenue.
Model Assumptions
Importance of Assumptions
Assumptions simplify models and make them tractable, but must be chosen carefully to reflect reality.
Example: Economic theory assumes demand decreases as price increases (price elasticity).
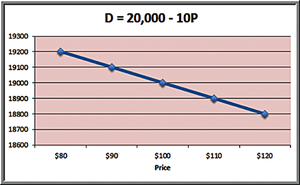
Example: Linear Demand Prediction Model
Model:
Where = demand, = price, = demand at zero price, = slope.
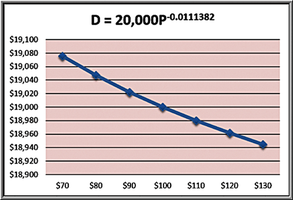
Example: Nonlinear Demand Prediction Model
Model:
Where = demand at zero price, = price elasticity.
Uncertainty and Risk
Definitions
Uncertainty: Imperfect knowledge of future events.
Risk: The consequences associated with uncertain outcomes.
Risk is inherent in business decisions and cannot be eliminated, only managed.
Problem Solving with Analytics
Steps in Problem Solving
Recognizing a Problem: Identifying gaps between actual and desired outcomes.
Defining the Problem: Clearly articulating the issue, considering complexity and stakeholders.
Structuring the Problem: Stating goals, possible decisions, and constraints.
Analyzing the Problem: Using analytics to evaluate scenarios and risks, and find solutions.
Interpreting Results and Making a Decision: Understanding model limitations and incorporating judgment.
Implementing the Solution: Translating model results into real-world actions and overcoming resistance to change.
