 뒤로
뒤로Ch 8
스터디 가이드 - 스마트 노트
 자료에 맞춘 맞춤형 노트, 핵심 정의, 예시, 맥락을 확장해 제공합니다.
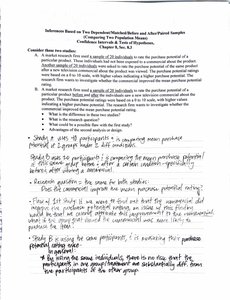
Inferences Based on Two Dependent/Matched/Before and After/Paired Samples
Comparing Two Population Means: Confidence Intervals & Tests of Hypotheses
This topic explores statistical methods for comparing two population means using paired or dependent samples. Such designs are common in business and marketing research, where the same subjects are measured before and after an intervention, or matched pairs are used to control for confounding variables.
Paired Samples: Observations are linked, either by measuring the same individuals twice or by matching individuals across groups.
Research Question: Does an intervention (e.g., a commercial or training) cause a significant change in the mean outcome?
Advantages: Controls for individual differences, increases statistical power, and reduces variability.
Possible Flaws in Independent Samples: Without pairing, differences between groups may be due to confounding factors rather than the intervention.
Example: Comparing purchase potential ratings before and after exposure to a commercial, or test scores before and after a training program.
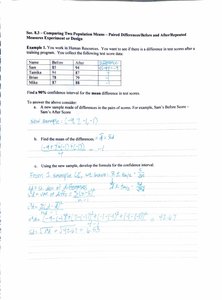
Sec. 8.3 - Comparing Two Population Means - Paired Differences/Before and After/Repeated Measures Experiment or Design
Constructing a Confidence Interval for the Mean Difference
To estimate the effect of an intervention, we calculate the mean difference between paired observations and construct a confidence interval for this mean difference.
Step 1: Create a new sample consisting of the differences between paired scores (e.g., After - Before).
Step 2: Calculate the mean of the differences ().
Step 3: Calculate the standard deviation of the differences ().
Step 4: Use the following formula for the confidence interval:
Step 5: Interpret the confidence interval: If 0 is not included, there is evidence of a significant difference.
Example: Test scores before and after training for four employees.
Hypothesis Testing for Paired Samples
Testing the Effectiveness of an Intervention
To formally test whether the intervention had a significant effect, we conduct a hypothesis test for the mean difference.
Null Hypothesis (): (no difference)
Alternative Hypothesis (): (difference exists)
Test Statistic:
Decision Rule: Compare the calculated t-statistic to the critical value from the t-distribution.
p-value: The probability of observing a result as extreme as the sample, assuming is true.
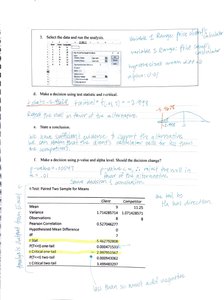
Conclusion: If p-value < alpha, reject ; otherwise, fail to reject .
Comparison: Results from confidence intervals and hypothesis tests are closely related but may not always match due to differences in interpretation and significance levels.
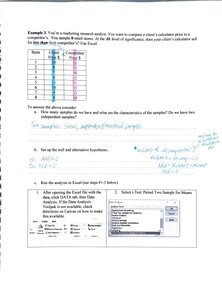
Paired Sample Analysis in Excel
Using Excel for Paired t-Test
Excel provides tools for conducting paired sample t-tests, which are useful for business applications such as comparing product prices or evaluating training effectiveness.
Step 1: Enter paired data into two columns.
Step 2: Use Data Analysis Toolpak > t-Test: Paired Two Sample for Means.
Step 3: Select the data and run the analysis.
Step 4: Interpret output: mean difference, t-statistic, p-value, and confidence interval.
Example: Comparing calculator prices between a client and competitor across 8 stores.
Conditions and Assumptions for Valid Inference
Requirements for Paired Sample Analysis
To ensure valid inference about the mean difference (), certain conditions must be met:
Large Sample: If sample size is large (n > 30), the Central Limit Theorem applies.
Small Sample: For small samples, differences should be approximately normally distributed.
Independence: Pairs must be independent of each other.
Application: These conditions are critical for business decisions based on statistical analysis, such as evaluating marketing strategies or product pricing.
