 뒤로
뒤로Two-Sample Tests in Business Statistics: Means, Proportions, and Variances
스터디 가이드 - 스마트 노트
 자료에 맞춘 맞춤형 노트, 핵심 정의, 예시, 맥락을 확장해 제공합니다.
Two-Sample Tests
Two-sample tests are fundamental tools in business statistics for comparing two populations. These tests help determine whether there are significant differences between two groups in terms of means, proportions, or variances. The choice of test depends on the type of data and the relationship between samples.
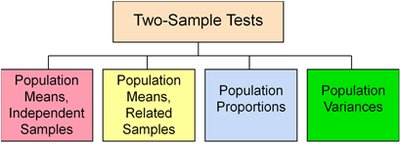
Population Means: Independent Samples
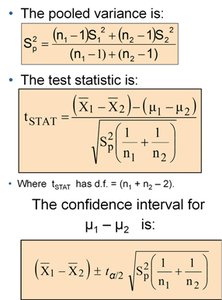
When comparing the means of two independent populations, we often assume both populations are approximately normal and may have equal or unequal variances. The pooled variance method is used when variances are assumed equal.
Pooled Variance Formula: The pooled variance combines the sample variances from both groups to estimate the common population variance.
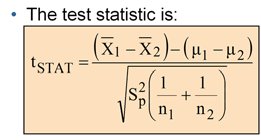
Test Statistic: The t-statistic for comparing two means is calculated as:
Degrees of Freedom:
Confidence Interval for :
Example Application: Comparing dividend yields between NYSE and NASDAQ stocks using independent samples.
Population Means: Related (Paired) Samples
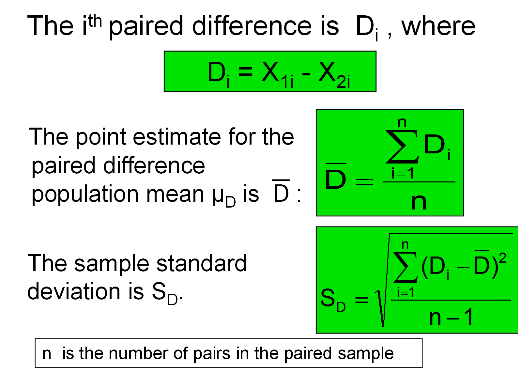
Paired sample tests are used when the samples are related, such as before-and-after measurements on the same subjects. The analysis focuses on the differences within each pair.
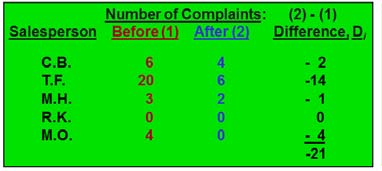
Paired Difference ():
Mean of Differences:
Sample Standard Deviation of Differences:
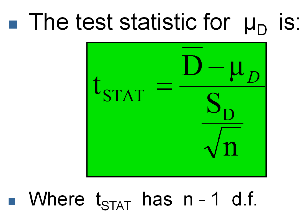
Test Statistic for Paired Differences:
Degrees of Freedom:
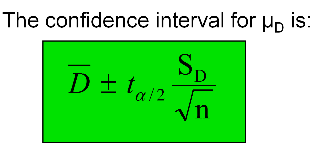
Confidence Interval for :
Example Application: Measuring the effect of a training workshop on the number of customer complaints before and after training.
Population Proportions
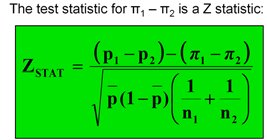
When comparing two population proportions, the test statistic is based on the difference between sample proportions. The pooled proportion is used to estimate the standard error.
Pooled Proportion:
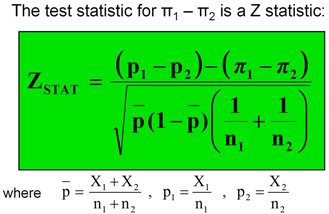
Test Statistic (Z):
Where: ,
Example Application: Testing if there is a significant difference in the proportion of men and women who will vote Yes on a proposition.
Population Variances
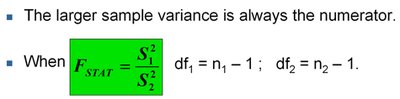
To compare the variances of two populations, the F-test is used. The larger sample variance is always placed in the numerator to ensure the F-statistic is greater than or equal to 1.
F Statistic:
Degrees of Freedom: ,
Example Application: Testing if there is a difference in variances between NYSE and NASDAQ dividend yields.
Summary Table: Two-Sample Test Types
Test Type | Data Structure | Test Statistic | Key Formula |
|---|---|---|---|
Means (Independent) | Two independent samples | t | |
Means (Paired) | Paired (related) samples | t | |
Proportions | Two independent samples | Z | |
Variances | Two independent samples | F |
Additional info: These tests are essential for inferential statistics in business, allowing analysts to make data-driven decisions about differences between groups, such as comparing product performance, customer satisfaction before and after interventions, or market behaviors across segments.
