
교과서 질문
A capacitor is a device in an electrical circuit that stores charge. In one particular circuit, the charge on the capacitor Q varies in time as shown in the figure. <IMAGE>
b. Is Q′ positive or negative for t≥0?
175
views

 검증된 단계별 안내
 04:16
04:16
 05:44
05:44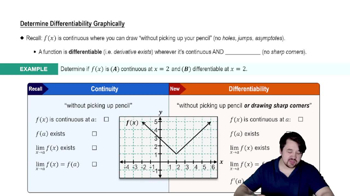 05:02
05:02A capacitor is a device in an electrical circuit that stores charge. In one particular circuit, the charge on the capacitor Q varies in time as shown in the figure. <IMAGE>
b. Is Q′ positive or negative for t≥0?
Where is the function continuous? Differentiable? Use the graph of f in the figure to do the following. <IMAGE>
c. Sketch a graph of f'.
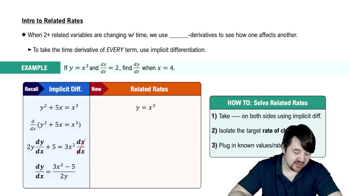
Robert Boyle (1627–1691) found that for a given quantity of gas at a constant temperature, the pressure P (in kPa) and volume V of the gas (in m³) are accurately approximated by the equation V=k/P, where k>0 is constant. Suppose the volume of an expanding gas is increasing at a rate of 0.15 m³/min when the volume V=0.5 m³ and the pressure is P=50 kPa. At what rate is pressure changing at this moment?
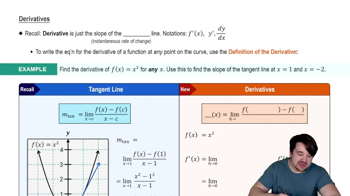
Evaluate and simplify y'.
x = cos (x−y)
An object oscillates along a vertical line, and its position in centimeters is given by y(t)=30(sint - 1), where t ≥ 0 is measured in seconds and y is positive in the upward direction.
At what times and positions is the velocity zero?
An object oscillates along a vertical line, and its position in centimeters is given by y(t) = 30(sin t - 1), where t ≥ 0 is measured in seconds and y is positive in the upward direction.
The acceleration of the oscillator is a(t) = v′(t). Find and graph the acceleration function.